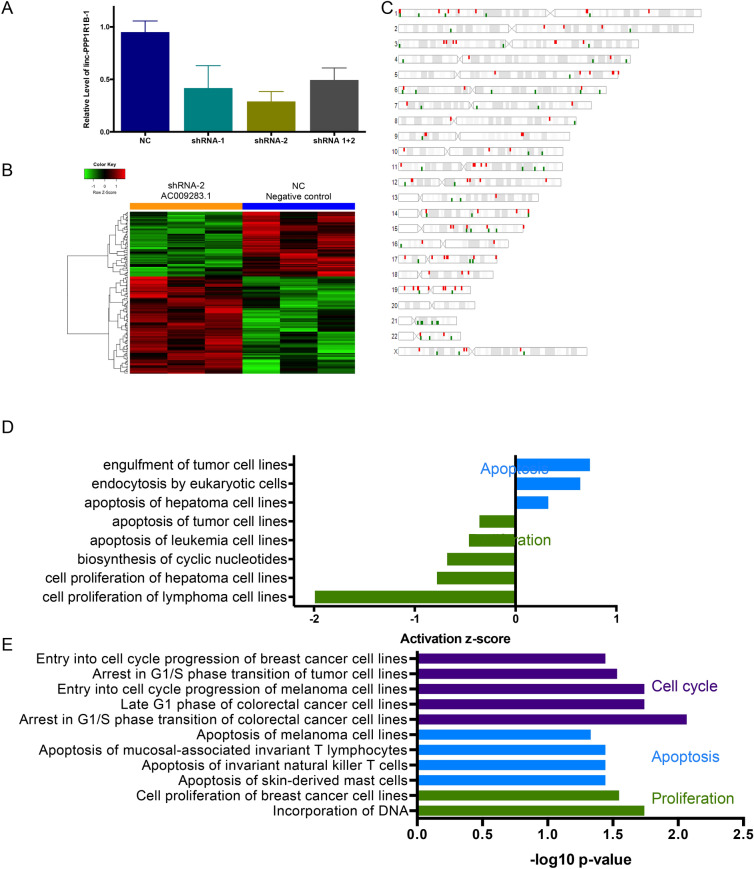
Figure 4.
(A) Real-time qPCR illustrating gene silencing by shRNA against AC009283.1 in SKBR3, a HER2-enriched cell line model. (B) Supervised hierarchical cluster analysis shows 158 differentially expressed genes after AC009283.1 knockdown (Foldchange < − 1.2, > 1.2 p-value < 0.05); we observed 94 up-regulated and 64 down-regulated genes in shRNA-2 vs NC and (C). Their distribution across the genome. (D) Ingenuity Pathway Analysis of 158 genes differentially expressed after knockdown of AC009283.1 in SKBR3 cells. (E) Enrichment pathway analysis of genes differently expressed in samples of HER2-enriched tumors from TCGA with high vs low expression of AC009283.1.

