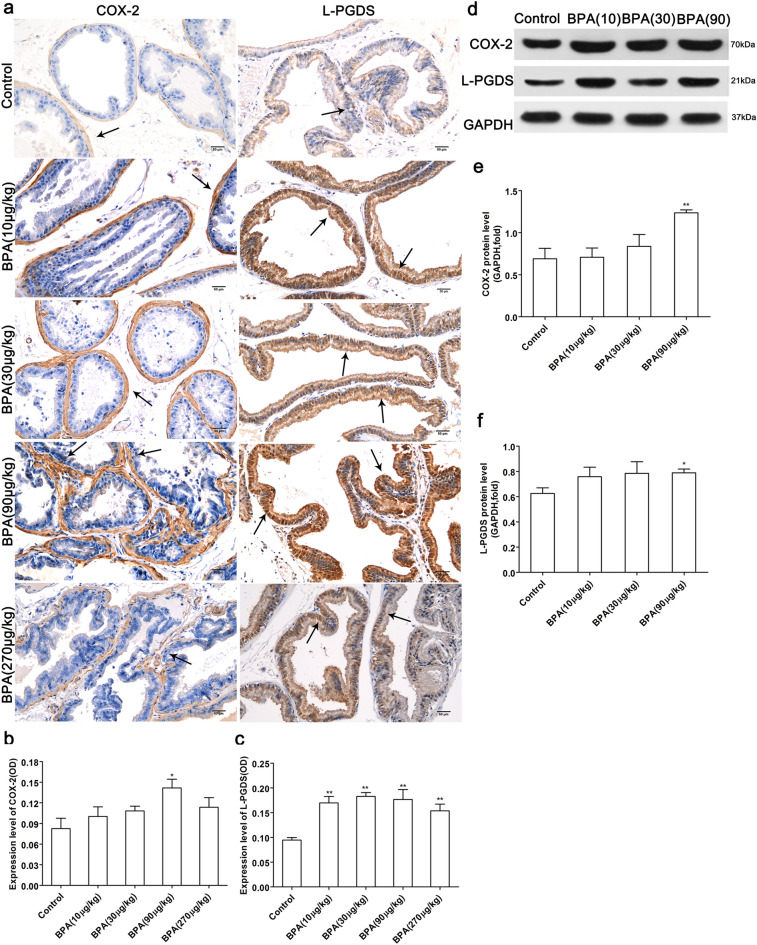
Figure 7.
Effect of BPA on the expression of COX-2 and L-PGDS in the prostate. (a) Immunohistochemical images of COX-2 in the dorsolateral prostate and L-PGDS in the ventral prostate; Effect of BPA on COX-2 (b) and L-PGDS (c) expression in the prostate. (Scale bar = 50 µm, magnification × 200, n = 4). The protein bands of COX-2 and L-PGDS (d); The expression levels of the COX-2 protein in the dorsolateral prostate (e) and L-PGDS protein in the ventral prostate (f). Blots (d) were cropped from the gel presented in Supplementary Fig. 1. Bands were quantified using densitometry, with the results normalized to GAPDH expression in each sample (n = 3). Values are presented as mean ± SD (*P < 0.05, **P < 0.01, compared to the control).

