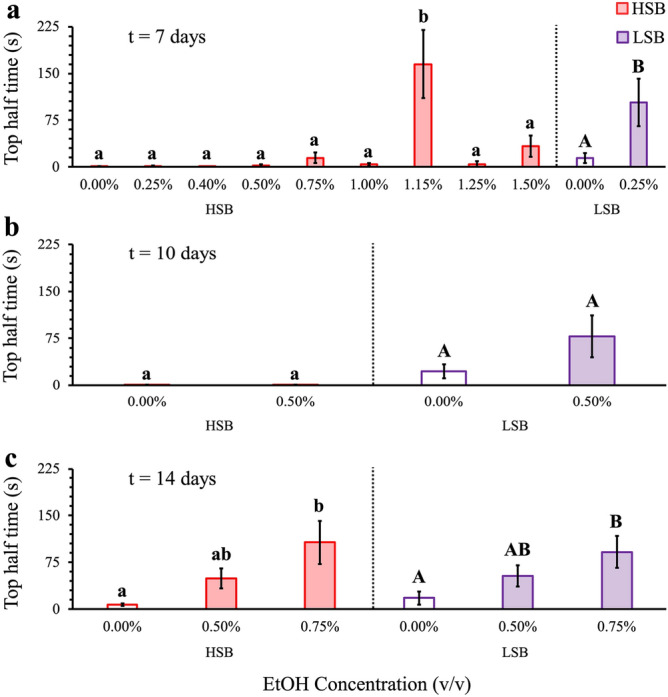
Figure 1.

Dose response analysis of ethanol concentration on time spent in the top half of the tank during NTDT. Measured time spent in the top half of the tank after (a) 7, (b) 10, or (c) 14 days of treatment. Control groups are represented by unfilled in bars, while ethanol-treated groups are represented by filled bars. HSB and LSB are red and purple, respectively. Data shown are mean ± 1 SEM. Individual differences within the HSB line are indicated by lower case letters, while differences within the LSB line are indicated by upper case letters.
