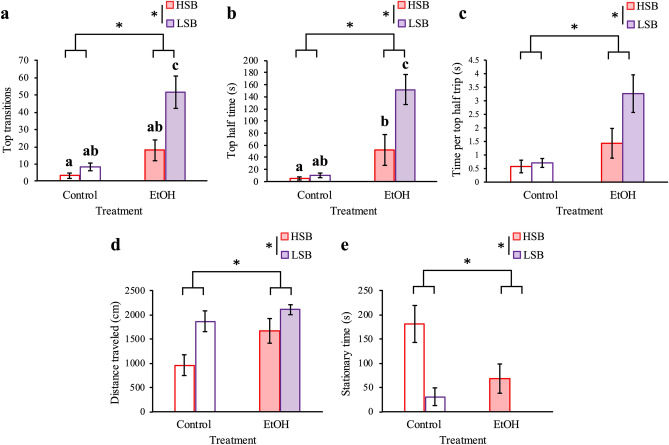
Figure 2.
Differentiated ethanol treatment effect on stress-related behaviors between lines with no effect on locomotion. We measured top transitions (a), time in top half of the tank (b), average time spent in top half per trip (c), distance traveled (d), and stationary time (e) for each treatment group. Control groups are represented by unfilled in bars, while ethanol-treated groups are represented by filled bars. HSB and LSB are red and purple, respectively. Data shown are mean ± 1 SEM. Significant line and treatment differences are indicated by an asterisk (p ≤ 0.05), while differences between groups are indicated by different lower-case letters. The number of subjects tested in each group are as follows: 17 HSB control, 17 LSB control, 15 HSB EtOH, 16 LSB EtOH.

