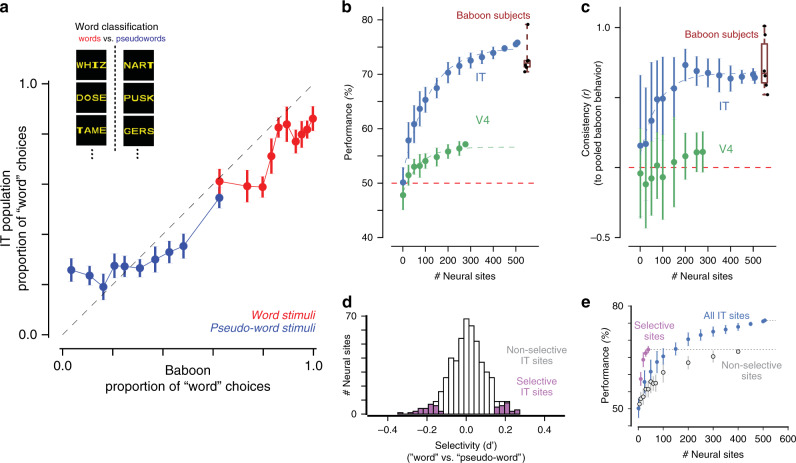
Fig. 2. Sufficiency of IT population for word classification.
a Comparison of baboon behavior and a linear readout of IT neurons, plotted as the proportion of stimuli categorized as “words.” The 616 individual stimuli were grouped into equally sized bins based on the baboon performance, separately for words (red) and pseudowords (blue). Error bars correspond to SEM, obtained via bootstrap resampling over stimuli (n = 100 bootstrap samples); dashed line corresponds to unity line, demarking a perfect match between baboon behavior and IT-based decoder outputs. b Performance of decoders trained on IT and V4 representations on word classification, for varying number of neural sites. Distribution of individual baboon performance is shown on the right (median 72%, interquartile range = 1%, data range = 8.7%, n = 6 baboon subjects). c Consistency with baboon behavioral patterns of decoders trained on IT and V4 representations, for varying number of neural sites. Distribution of individual baboon consistency is shown on the right (median , interquartile range = 0.27, data range = 0.49, n = 6 baboon subjects). d Distribution of selectivity of word classification for individual IT sites, highlighting the subpopulation of sites with selectivity significantly different from zero. e Performance of decoders trained on subpopulation of selective sites from d compared to remaining IT sites and all IT sites. Error bars in b, c, and e correspond to SD across samples of neural sites (n = 100 feature samples).

