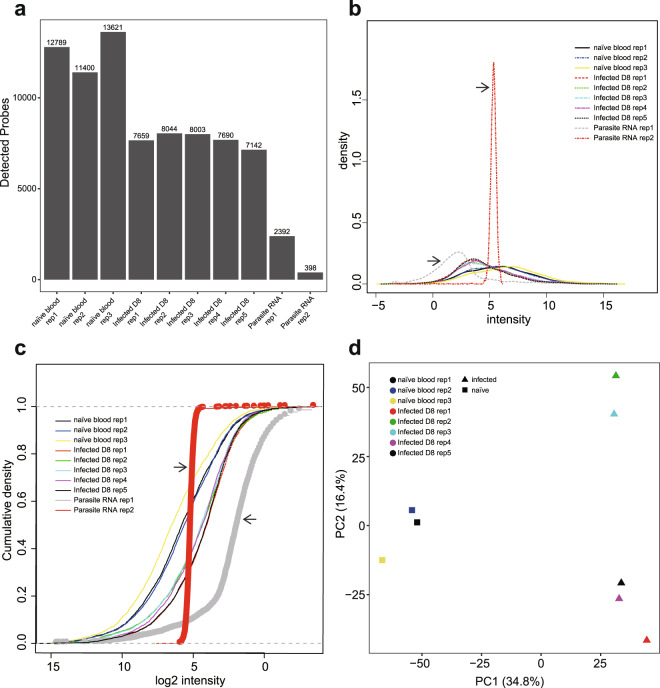
Fig. 6.
Validation of parasite RNA does not affect BeadChip gene expression results. (a) Bar chart showing the number of probes detected in each sample. (b) Density plot of non-normalised expression data showing the signal density distribution. (c) Cumulative distribution function plot of non-normalised expression data of each sample. Arrowheads indicate parasite samples. (d) PCA plot of normalised expression data from infected and naïve blood samples after excluding parasite samples. This dataset was submitted to GEO (GSE145634).

