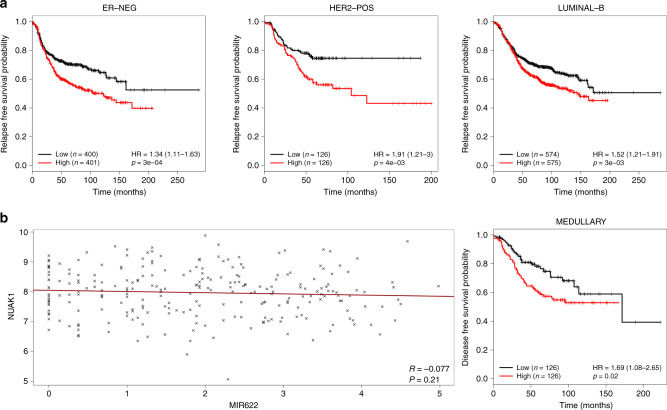
Fig. 4. Relationships between NUAK1 expression and survival probabilities in intrinsic subtypes of breast cancer.
a Kaplan–Meier curves showing the relapse-free survival probability in ER-negative, HER2-positive and luminal-B breast cancers subtypes for NUAK1. Patients were split in “Low” and “High” based on NUAK1 median gene expression level. Significance was assessed by Chi-Square test. b Medullary breast cancer (GSE21653). Left panel: scatter plot showing the inversely correlated expression of miR-622 (X-axis) and NUAK1 (Y-axis) (Pearson r = −0.077; p = 0.21). The linear fit is shown in dark red. Right: disease-free survival probability based on NUAK1 expression levels. Patients were split in “Low” and “High” based on NUAK1 median expression level. Expression data were Log2 transformed before plotting. Significance was assessed by log-rank test. Hazard Ratios and the respective 95% confidence interval are shown in parentheses.

