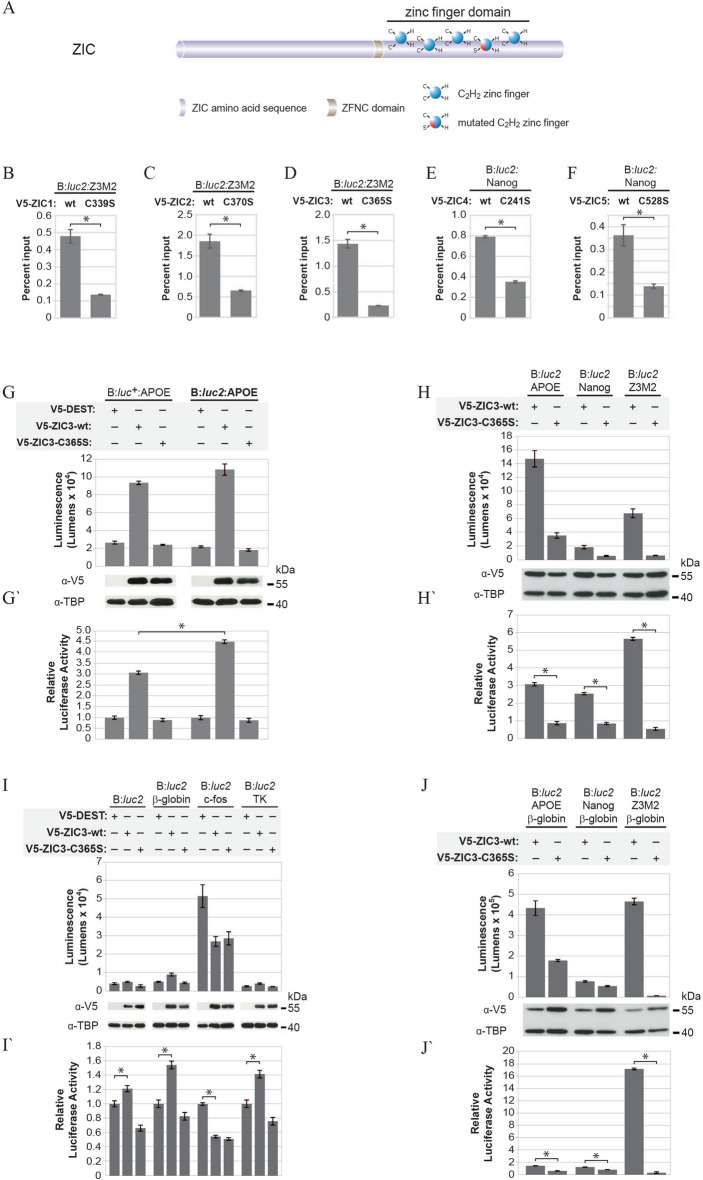
Figure 1.
A new trans-activation assay for ZIC proteins. (A) Schematic representation of the missense mutation [second cysteine (C) converted to serine (S)] introduced into each ZIC protein. (B–F) qPCR (N = 3) output following pIP from HEK293T cells co-transfected with the reporter construct (above line) and expression constructs (below line) shown. Error bars represent SD between three repeats, *p < 0.01 t-Test. (G–J) HEK293T cells were co-transfected with the reporter constructs (above line) and expression constructs (below line) shown. V5-DEST was also co-transfected with each reporter construct to measure background (not shown in panels H and J, see Fig. S1 for all data). For each transfection, luminescence was measured 24 h post-transfection in each of three replicate samples and each transfection repeated three times (N = 3). In each panel, the top graph (G–J) shows one representative experiment with the corresponding western blot. Error bars represent the SD between the three replicates. Expression of transfected proteins was confirmed with α-V5 and the α-TBP blot served as nuclear fraction loading control. Although cropped blots were used, the gels were run under the same experimental conditions. The bottom graph (G′–J′) shows the mean RLA (normalised to V5-DEST such that the V5-DEST value becomes 1; not shown in H′ and J′) value from three independent repeats, Error bars represent SEM. *p < 0.01 ANOVA.

