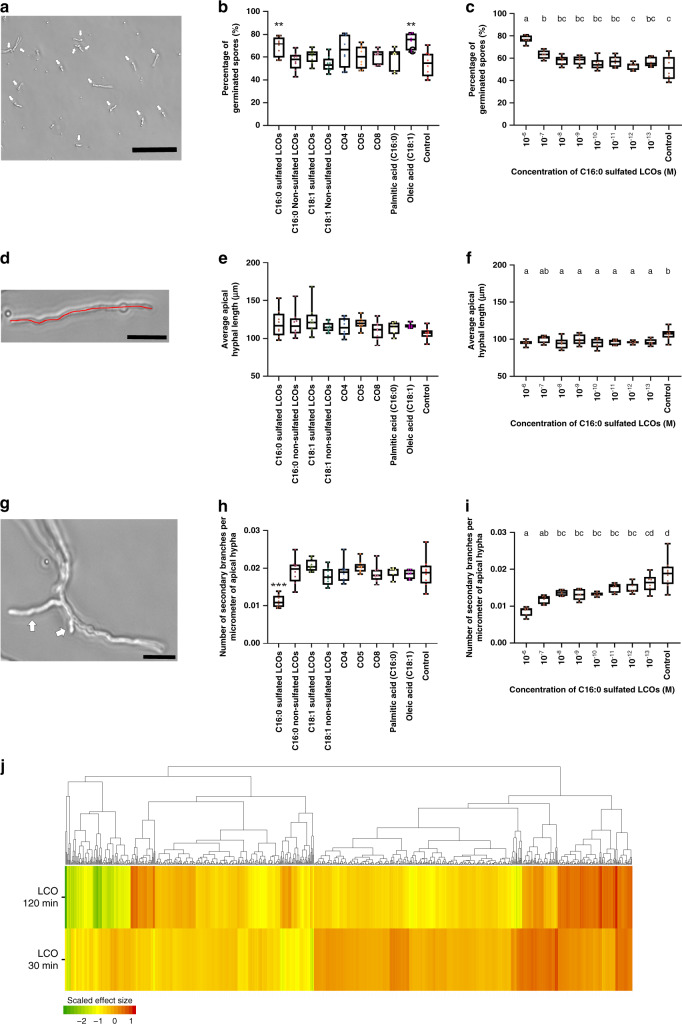
Fig. 3. Effects of LCOs, COs, and fatty acids on A. fumigatus.
a Germinated spores are indicated by white arrows. The scale bar is 100 µm. b Percentage of germinated spores 10 h after treatment with various molecules at 10−8 M. (**) indicates a significant difference between C16:0 sulfated LCO or oleic acid treatments and the control according to Dunnett’s multiple comparison procedure, the p-value is 7.21 × 10⁻⁴. Each treatment was analyzed in eight independent wells, except the palmitic and oleic acid treatments that were analyzed in six of them. c Effect of a range of C16:0 sulfated LCO concentrations on the percentage of germinated spores; one-way ANOVA p-value of 6.32 × 10⁻⁸. Each LCO concentration was analyzed in six wells, except for the control treatments that were analyzed in eight of them. d An example of an apical hypha germinated from both sides of a spore whose length measured is indicated in red. Scale bar is 25 µm. e Length of apical hyphae after 12 h treatment with various molecules at 10−8 M. There were no significant differences between treatments. Each treatment was analyzed in eight independent wells, except palmitic and oleic acid treatments that were analyzed in six of them. f Effect of a range of C16:0 sulfated LCO concentrations on the apical hyphae length; one-way ANOVA p-value is 3.91 × 10⁻³. Each LCO concentration was analyzed in six independent wells, except the control which was analyzed in eight of them. g Germination of a control spore showing two secondary branches (arrows) on a germinating apical hypha. Scale bar is 25 µm. h The ratio of secondary branches per micrometer of apical hypha after 12 h treatment with various molecules at 10−8 M. (***) indicates a significant difference between C16:0 sulfated LCO treatments and the control according to Dunnett’s multiple comparison procedure, p-value is 5.89 × 10⁻⁹. Each treatment was analyzed in eight independent wells, except palmitic and oleic acid treatments, which were analyzed in six of them. The ratio was determined by calculating the number of secondary branches for that specific apical hyphal branch length. i Effect of a range of C16:0 sulfated LCO concentrations on the ratio of secondary branches; one-way ANOVA p-value is 1.54 × 10⁻⁹. Each LCO concentration was analyzed in six independent wells, except the control which was analyzed in eight of them. The ratio was determined by calculating the number of secondary branches for that specific apical hyphal branch length. In box plots (c, f, i), different letters indicate significant differences and similar letters indicate no difference according to Tukey’s single-step multiple comparison procedure. In the box plots (b, c, e, f, h, i), the bars represent the minimum value, the first quartile, the median, the third quartile, and the maximum value such that 25% of the data are in each section. j Heatmap showing the scaled effect size of differentially expressed genes 30 and 120 min after C16:0 sulfated LCO treatment at a concentration of 10−8 M compared with the control solution. Source data are provided as a Source Data file.

