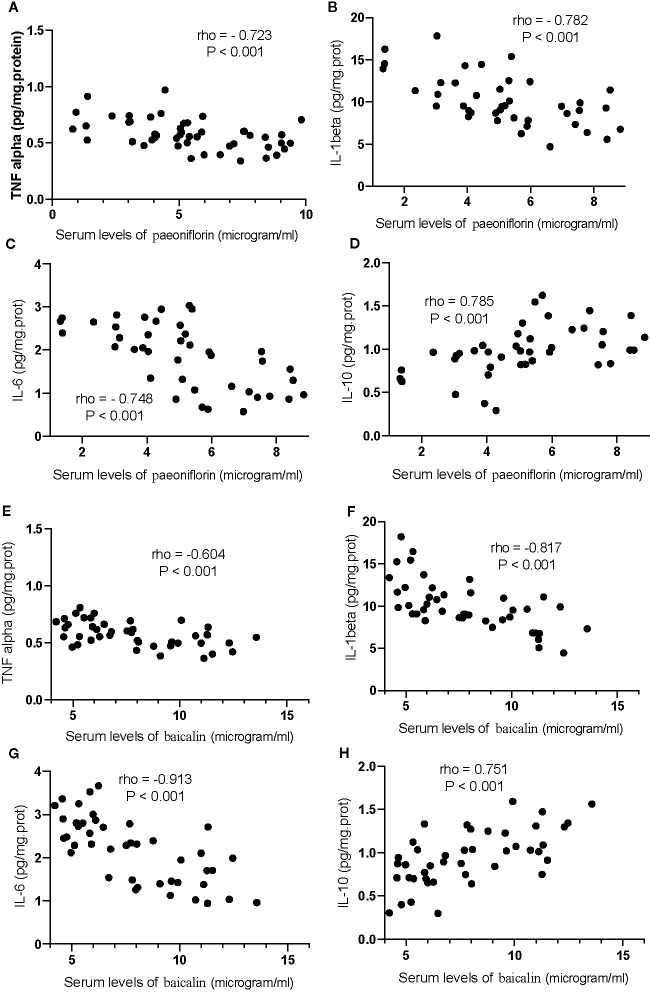
Figure 13.
The strong correlation between the levels of inflammatory cytokines and paeoniflorin or baicalin. (A) TNFα and paeoniflorin. (B) IL-1 β and paeoniflorin. (C) IL-6 and paeoniflorin. (D) IL-10 and paeoniflorin. (E) TNFα and baicalin. (F) IL-1 β and baicalin. (G) IL-6 and baicalin. (H) IL-10 and baicalin. There was a strong positive correlation if rho >0.5 and or a strong negative correlation if rho <−0.5.

