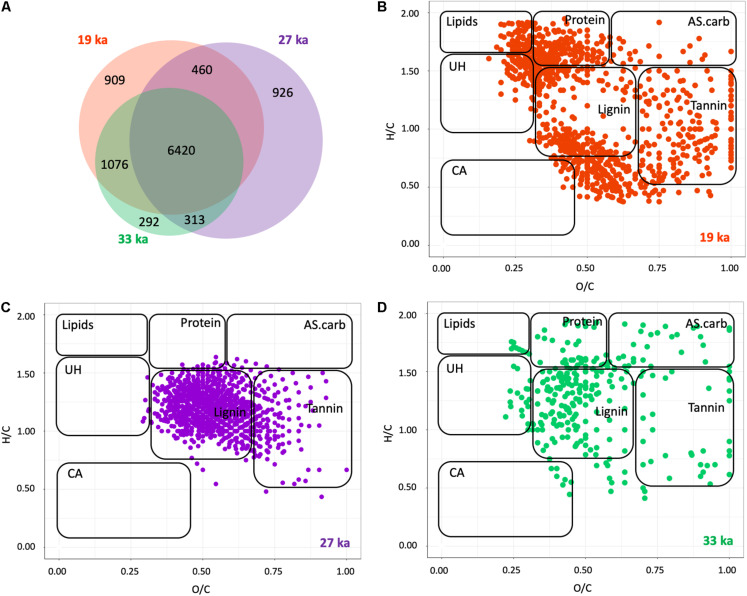
FIGURE 1.
Molecular composition of DOM shifts across the permafrost chronosequence. (A) Venn diagram of the unique and shared number of identified molecular formulae. (B–D) Van Krevelen diagrams based on FT-ICR MS peaks uniquely present in each of the DOM samples from (B) 19 ka, (C) 27 ka, and (D) 33 ka, general compound class ranges as described in Hodgkins et al. (2016). Compound classes are defined in Table S1 and as follows: Lipid, lipid-like; Protein, protein-like; AS.carb. aminosugar and carbohydrate-like; UH, unsaturated hydrocarbons; CA, condensed aromatics; Lignin, lignin-like; Tannin, tannin-like. The relative abundance of each class is found in Supplementary Table 3.

