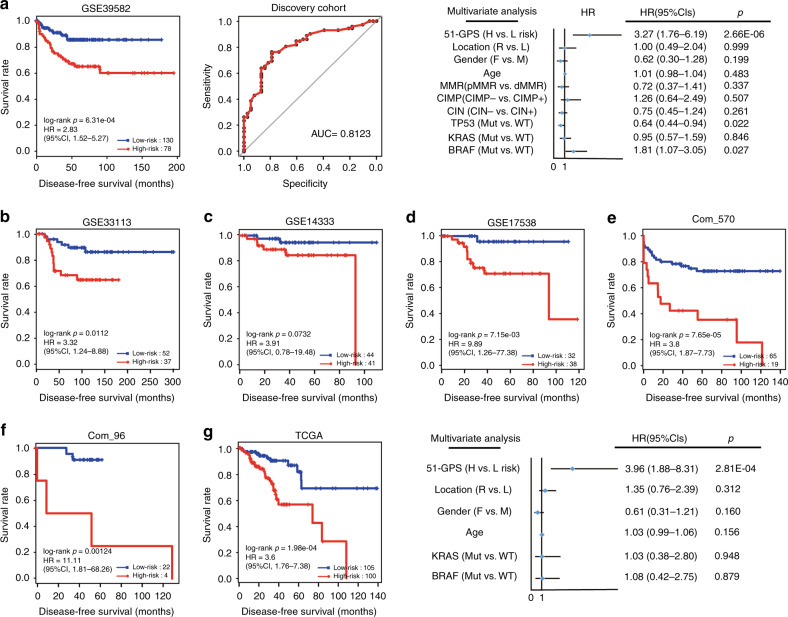
Fig. 2. The performance of the 51-GPS in discovery and validation cohorts.
a The Kaplan–Meier (K–M) curve of DFS for patients between high- and low-risk clusters in the discovery cohort (left); p values comparing risk clusters were calculated with the log-rank test. The assessment of the predictive consistency of signature via the AUC curve (middle). Multivariate Cox regression model was performed to assess the prognostic efficiency of 51-GPS (right). Solid dots represent the HR, and the open-ended horizontal lines represent the 95% CIs. b–f The validation of the prognostic capacities of 51-GPS in independent microarray datasets. g The K–M curve of DFS and multivariate Cox regression analysis in RNA-seq data.

