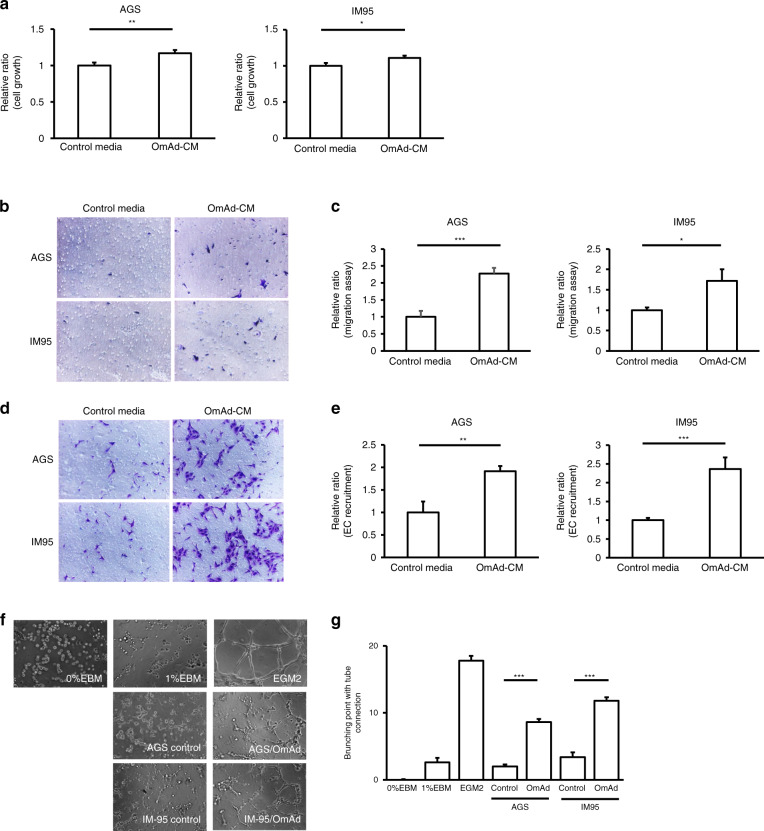
Fig. 1. Omental adipocytes induce GC cell growth/migration and in vitro angiogenesis.
Each graph represents the mean ± SE from three independent experiments. *P < 0.05; **P < 0.01; ***P < 0.001. a Cell growth. AGS and IM95 were used as GC cell lines. The relative ratios are shown of absorbance for OmAd-CM to those for control media (n = 5). Mean, AGS: 1.0 (control), 1.2 (OmAd-CM); IM95: 1.0 (control), 1.2 (OmAd-CM). b Representative images of migration assay (×100). c Quantification of migration assay. Migrated GC cells were counted from averages at four microscopic fields, and each result was presented as the mean of at least three independent experiments. Each value represents the mean relative ratio of migrated GC cells for OmAd-CM to that for control media. Mean, AGS: 1.0 (control), 2.3 (OmAd-CM); IM95: 1.0 (control), 1.7 (OmAd-CM). d Representative images of EC recruitment assay (×100). e Quantification of EC recruitment assay. Migrated HMVECs were counted from averages at four microscopic fields, and each result was presented as the mean of at least three independent experiments. Each value represents the mean relative ratio of migrated HMVECs co-cultured with OmAd-CM-treated GC cells to those co-cultured with control-treated GC cells. Mean, AGS: 1.0 (control), 1.9 (OmAd-CM); IM95: 1.0 (control), 2.4 (OmAd-CM). f Representative images of tube-formation assay (×100). g Quantification of tube-formation assay. EBM-2 with FBS 0 and 1% were used as negative controls and EGM2 was used as a positive control. Each value represents the mean number of branched tubes under each condition. Mean, 0 (0% EBM), 2.6 (1%EBM), 17.8 (EGM2); AGS: 2.0 (control), 8.6 (OmAd); IM95: 3.4 (control), 11.8 (OmAd).

