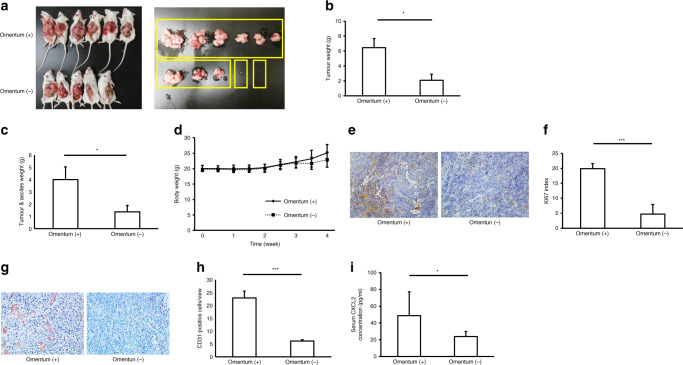
Fig. 3. Omentum enhances GC growth and peritoneal metastasis in an orthotopic tumour model.
Omentum-preserved group (n = 6); omentectomy group (n = 5). *P < 0.05; **P < 0.01; ***P < 0.001. a Representative macroscopic images of GC tumours in the omentum-preserved and omentectomy groups of SCID mice. SCID mice were subjected to laparotomy: the omentum-preserved group, in which the omentum was intact, and the omentectomy group, in which the omentum was excised, and then 1 × 10⁷ GC cells were injected into the stomach wall. Data are shown as tumours at 4 weeks after implantation. b GC growth in the omentum-preserved and omentectomy groups. Each bar represents the average weight of gastric tumours that were removed at 4 weeks after injection. Mean, 6.5 (omentum (+)), 2.1 (omentum (−)). c Peritoneal metastatic tumour and ascites. Each bar represents the average weight of peritoneal tumours and ascites collected at 4 weeks after injection. Mean, 4.0 (omentum (+)), 1.4 (omentum (−)). d Body weight curves. e Representative images of Ki67 immunohistochemistry (×200). f Ki67 index. Each bar represents the average rate of Ki67-positive cells in GC tumour tissues (×400). Mean, 19.9 (omentum (+)), 4.7 (omentum (−)). g Representative images of microvessel density (×200). h Tumour angiogenesis. Each bar represents the average number of CD31-positive microvessels in GC tumour tissues (×400). Mean, 22.9 (omentum (+)), 6.1 (omentum (−)). i Serum CXCL2 levels. Each bar represents the average serum CXCL2 level of mice. Mean, 48.8 (omentum (+)), 23.9 (omentum (−)).

