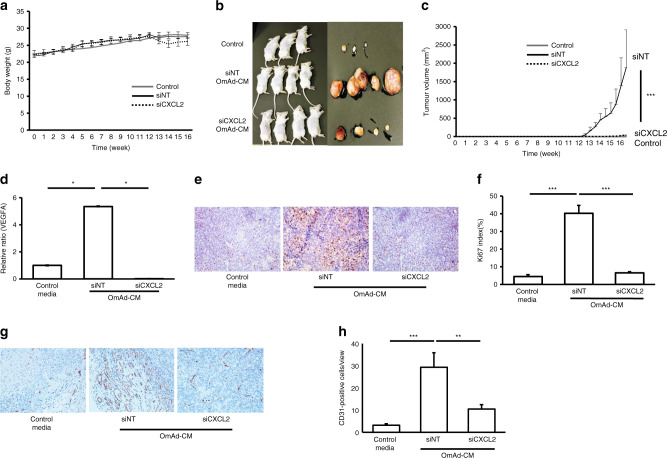
Fig. 4. CXCL2 in omental adipocytes is critical for GC growth in a xenograft model.
Control group: AGS cells treated with control media were subcutaneously injected with control media (n = 13). siNT OmAd-CM group: AGS cells treated with siNT OmAd-CM were subcutaneously injected with siNT OmAd-CM (n = 18). siCXCL2 OmAd-CM group: AGS cells treated with siCXCL2 OmAd-CM were subcutaneously injected with siCXCL2 OmAd-CM (n = 5). a Body weight curves. b Representative macroscopic images of resected tumours treated with control media, siNT OmAd-CM and siCXCL2 OmAd-CM in SCID mice. c Tumour growth curve. Tumour size and volume were measured twice per week. d VEGFA expression in tumour tissues. Each graph bar represents the relative ratios of 2−ΔΔCt of siNT OmAd-CM and siCXCL2 OmAd-CM to that of control media. Mean, 1.0 (control), 5.4 (siNT OmAd-CM), 0.1 (siCXCL2 OmAd-CM). e Representative images of Ki67 immunohistochemistry (×200). f Ki67 index. Each bar represents the average rate of Ki67-positive cells in GC tumour tissues (×400). Mean, 4.4 (control), 40.2 (siNT OmAd-CM), 6.5 (siCXCL2 OmAd-CM). g Representative images of tumour angiogenesis (×200). h Quantification of tumour angiogenesis. Each bar represents the average number of CD31-positive microvessels in GC tumour tissues (×400). Mean, 3.3 (control), 29.3 (siNT OmAd-CM), 10.5 (siCXCL2 OmAd-CM).

