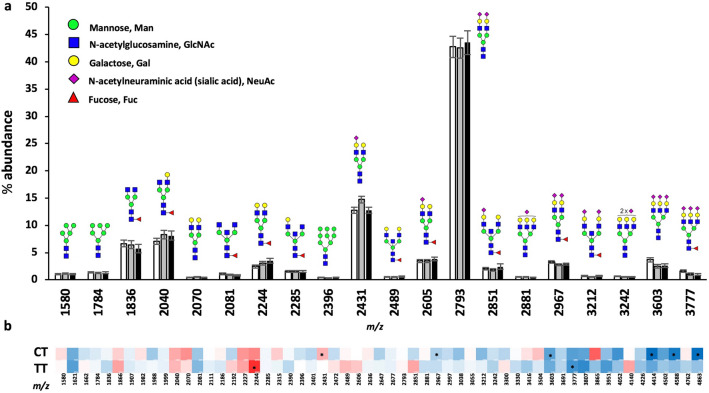
Figure 3.
Analysis of plasma protein N-glycans based on rs13107325 genotype. (a) Summary data for the 20 most abundant plasma protein N-glycans sorted by rs13107325 genotype. Data presented as mean +/− standard error of the mean (SEM) for the percent (%) abundance of each N-glycan relative to the total N-glycan pool. Corresponding N-glycan structures are shown above each predicted m/z (mass/charge ratio) including a key for individual monosaccharide components of human N-glycans. (b) Heat map illustrating percent change of each individual glycan in CT and TT relative to CC; scaled from dark blue → white → bright red as − 50.0% → 0% → + 50.0%. Genotypes compared using student’s t-test. Individual N-glycans that are significantly different in CT and TT compared to CC are marked with an asterisk; *p < 0.05. CC (white bars) n = 33, CT (gray bars) n = 31, TT (black bars) n = 25.

