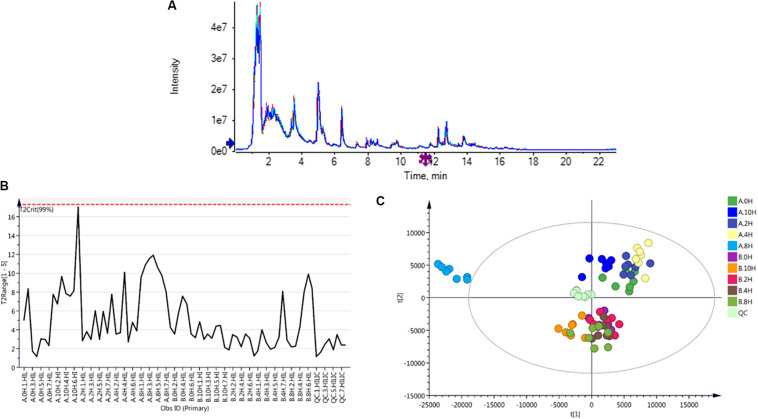
FIGURE 2.
(A) Total ion chromatogram (TIC) of QC samples; (B) Hotelling’s T2 chart of samples; (C) principal component analysis (PCA). A represents strain VH3, and B represents strain V23. Seven biological replicates were used for each treated sample. The QC sample, in which the same amount of each sample was used for mixing, was used to test the accuracy of the experiment and to judge the reliability of the sample grouping information in unsupervised component analysis.

