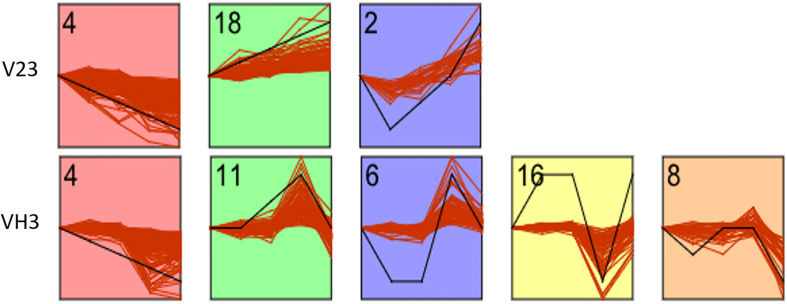
FIGURE 7.
STEM analysis of differential metabolites of two V. volvacea strains under low-temperature stress for different durations. The Y axis represents the relative content of metabolites, and the X axis represents the duration of low-temperature stress. The inflection point in the figure is the treatment time point (0, 2, 4, 8, and 10 h). The black line represents the trend pattern. Other red lines similar to the trend of this black line would be grouped into a class. Each red line represents a metabolite. The number in each figure is the number of profiles. There are 21 profiles in total. The figure shows the selected parts of profiles with research significance.

