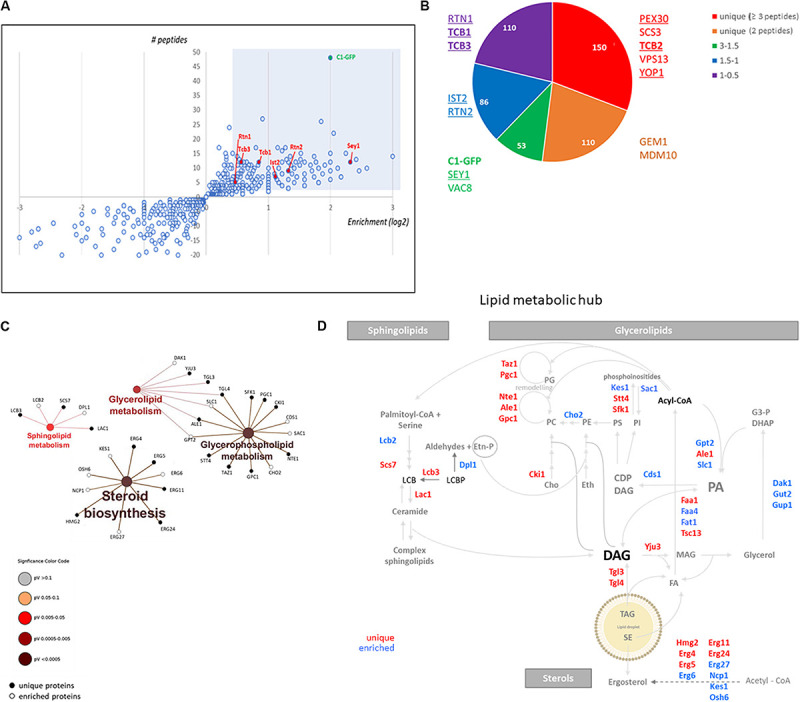
FIGURE 2.

DAG enriched membranes associated with LDs during growth resumption unveil a hub for lipid metabolism. (A) Distribution of proteins augmented in subphase fraction. Shaded area corresponds to the cut-off used for proteomic analysis for (B). (B) Distribution of proteins according to the categories described highlighting those associated with tubular ER and ER contact sites. Proteins identified in a previous study enriched in Yop1 are underlined. Members of the tricalbin family are in bold. (C) Enrichment of KEGG metabolic categories after analysis of proteins using the Cytoscape plugin ClueGo. Significance of the category nodes is indicated by their size and color code according to the scale shown at the right. Black filled circles correspond to proteins uniquely found in the GFP-trap sample, while open circles correspond to proteins enriched in C1δ-GFP membranes. (D) Lipid metabolic hub associated with the isolated DAG-rich membranes, including enzymatic steps in pathways for all three eukaryotic lipid classes.
