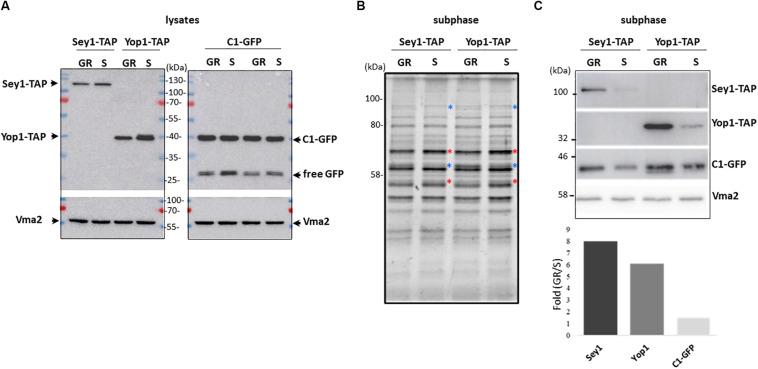
FIGURE 4.
Association of the ER-shaping proteins Yop1 and Sey1 with the LD-associated subphase increases upon growth resumption. (A) Twenty micrograms of total protein from the indicated whole cell lysates were loaded in each lane, transferred to a PVDF membrane, and blotted to detect the indicated proteins. (B) Protein profile as observed with 2,2,2-Trichloroethanol (TCE) staining of the LD-associated subphase fractions (before GFP enrichment). (A) 1.5% of the total isolated fraction was loaded in each lane. Red and blue asterisks point to bands that decreased and increased during growth resumption compared to stationary phase, respectively, (C) Western blot analysis of the gel shown in (B) and densitometry of the bands in the bottom. Quantification is expressed as fold increase upon growth resumption compared to stationary phase for Sey1-TAP, Yop1-TAP, and C1-GFP signal shown in (C) normalized using Vma2 as loading control. Quantified values for C1-GFP were the same for both independent Sey1-TAP and Yop1-TAP samples. Rabbit anti mouse IgG crosslinked to horse radish peroxidase was used to detect protein A-tagged Yop1 and Sey1. Expected molecular weights: Yop1-TAP – 41 kDa; Sey1-TAP – 110 kDa, C1δ-GFP (DAG sensor)—43 kDa; Vma2 (vacuole marker)—57 kDa; and free GFP – 27 kDa.

