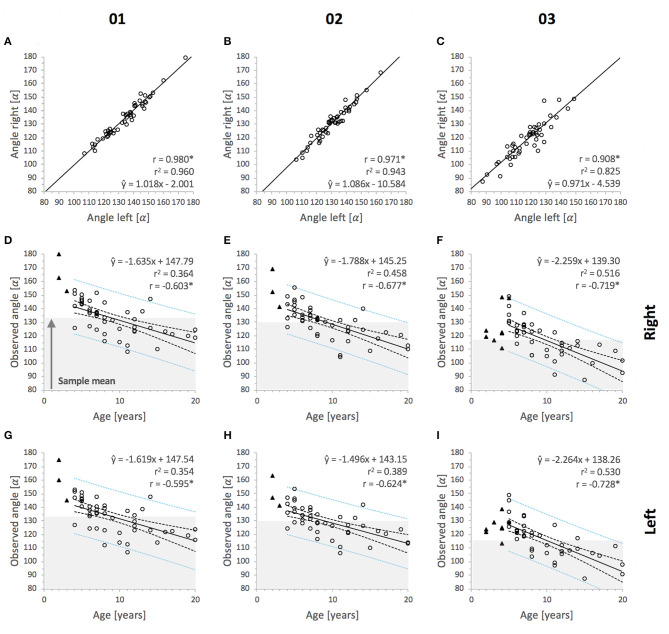
Figure 6.
Linear regression and Pearson's correlation analysis show the association of observed IIA values between both sides and the age of horses. The prediction equation and regression parameters are displayed in the plots and specified as ŷi = ± β1 (slope) xi ± β0 (intercept); α, alpha angle degrees. (A–C) Correlation diagrams show the association of IIA between corresponding permanent and deciduous incisors from the left and right side. Pearson's correlation coefficients (r) and coefficients of determination (r2), displayed in the plots, were calculated for each tooth position: (A) Triadan 01, (B) Triadan 02, (C) Triadan 03. *Positive correlations were significant at P < 0.001 (two-sided), n = 48 horses. Line indicates trend line. (D–I) Correlation diagrams show the association between IIA of permanent incisors and the age of horses. The upper limit of gray areas indicates mean values for permanent incisors. IIA data from deciduous incisors (triangles) were not included in the analysis. r and r2 were calculated for each tooth position and displayed in the plots. *Negative correlations were significant at P < 0.001 (two-sided), n = 45 horses (01 and 02), n = 40 horses (03). Lines indicate trend lines; inner dashed lines indicate upper and lower 95% confidence intervals for the regression line and outer dotted lines indicate upper and lower 95% prediction intervals.

