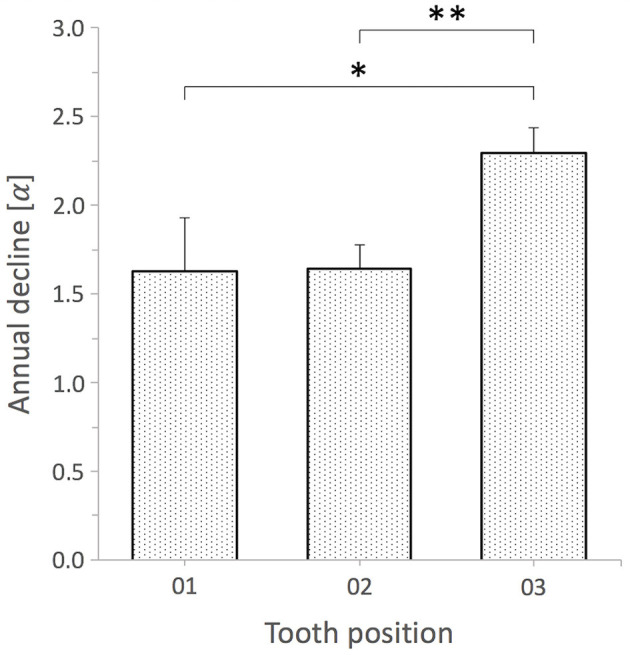
Figure 8.

Comparison of annual angle decline of permanent incisors by tooth position. Bar plots display mean + SE (error bars). Tooth position 01 vs. 03 and 02 vs. 03 exhibit significant differences; *, **P < 0.0001 whereas tooth position 01 vs. 02 did not; P = 0.915, GLME model, n = 45 horses (01 and 02), n = 40 horses (03).
