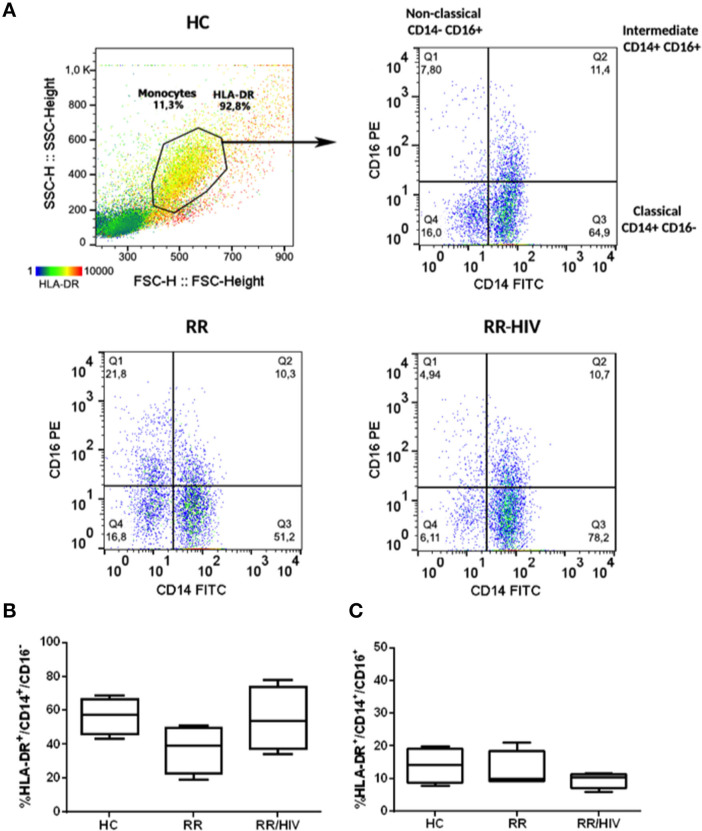
Figure 1.
Profile Monocytes in reversal reaction (RR) patients with and without HIV. (A) Dot plot representing the gate strategy used for analysis. (B) The percentages of HLA-DR+CD14+CD16− and (C) HLA-DR+CD14+CD16+ monocytes were demonstrated. Healthy controls (HC; n = 5), RR (n = 5), RR/HIV (n = 8).

