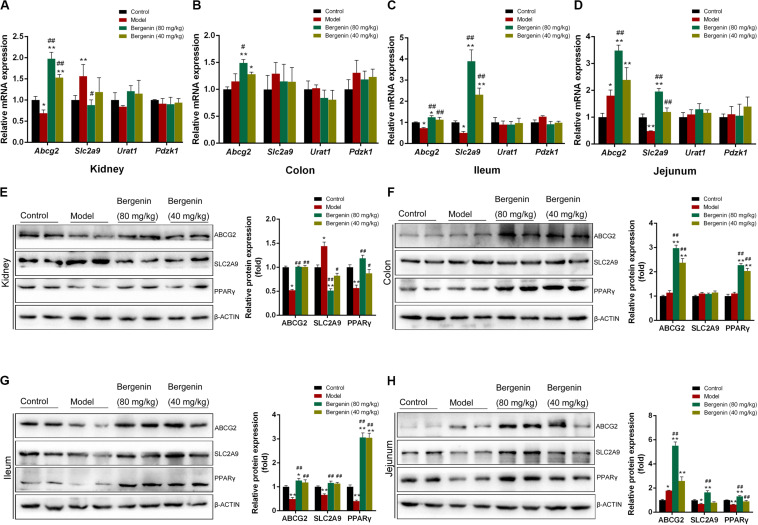
FIGURE 3.
Effects of bergenin on urate transporters in the kidney and intestine. (A) Relative mRNA levels of ABCG2, SLC2A9, URAT1, and PDZK1 in the kidneys determined by RT-PCR. (B–D) Relative mRNA levels of ABCG2, SLC2A9, PDZK1, and SLC17A3 in the colon (B), ileum (C), and jejunum (D) determined by RT-PCR. (E–H) Representative western blot analysis showing ABCG2, SLC2A9, and PPARγ protein levels in the kidneys (E), colon (F), ileum (G), and jejunum (H), and quantitative analysis of the band intensities. Protein levels were normalized to GAPDH. Data are presented as mean ± SEM. *P < 0.05 and **P < 0.01, compared to the control group; #P < 0.05 and ##P < 0.01 compared to the model group; n = 4–6.

