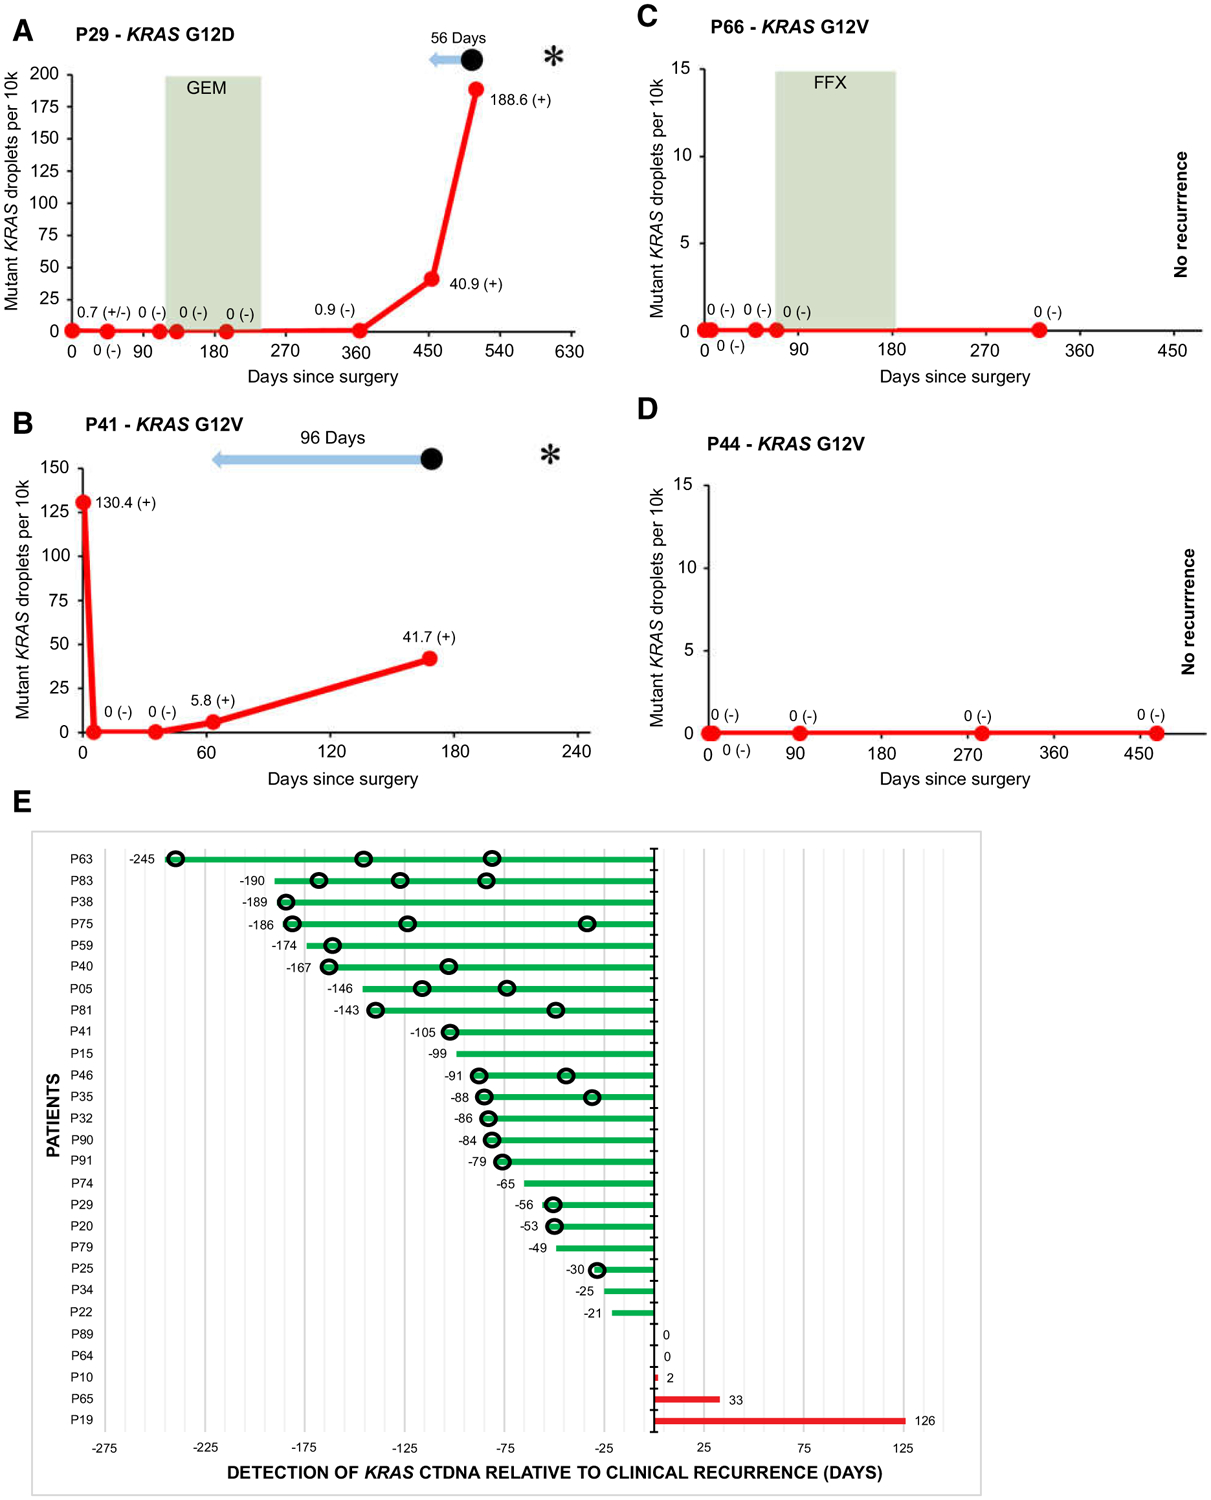
Figure 3.

Examples of individual patient graphs showing detectable KRAS ctDNA during follow-up in patients with recurrence (A and B), and no KRAS ctDNA detected during follow-up in patients without recurrence (C and D). E, Plot showing timing of detection of KRAS ctDNA relative to manifestation of clinical recurrence in 27 patients with detectable KRAS ctDNA and recurrence during postpancreatectomy follow-up. In A–D,  signifies chemotherapy treatment. FFX, FOLFIRINOX; GEM, gemcitabine.
  Signifies lead time of KRAS ctDNA detection relative to clinical recurrence. • signifies clinical disease recurrence; * signifies patient death; (−) signifies a negative KRAS ctDNA result; (±) signifies a borderline KRAS ctDNA result; (+) signifies a positive KRAS ctDNA result. Sample at timepoint 0 represents the preoperative sample. In E,
  signifies imaging without disease recurrence.
