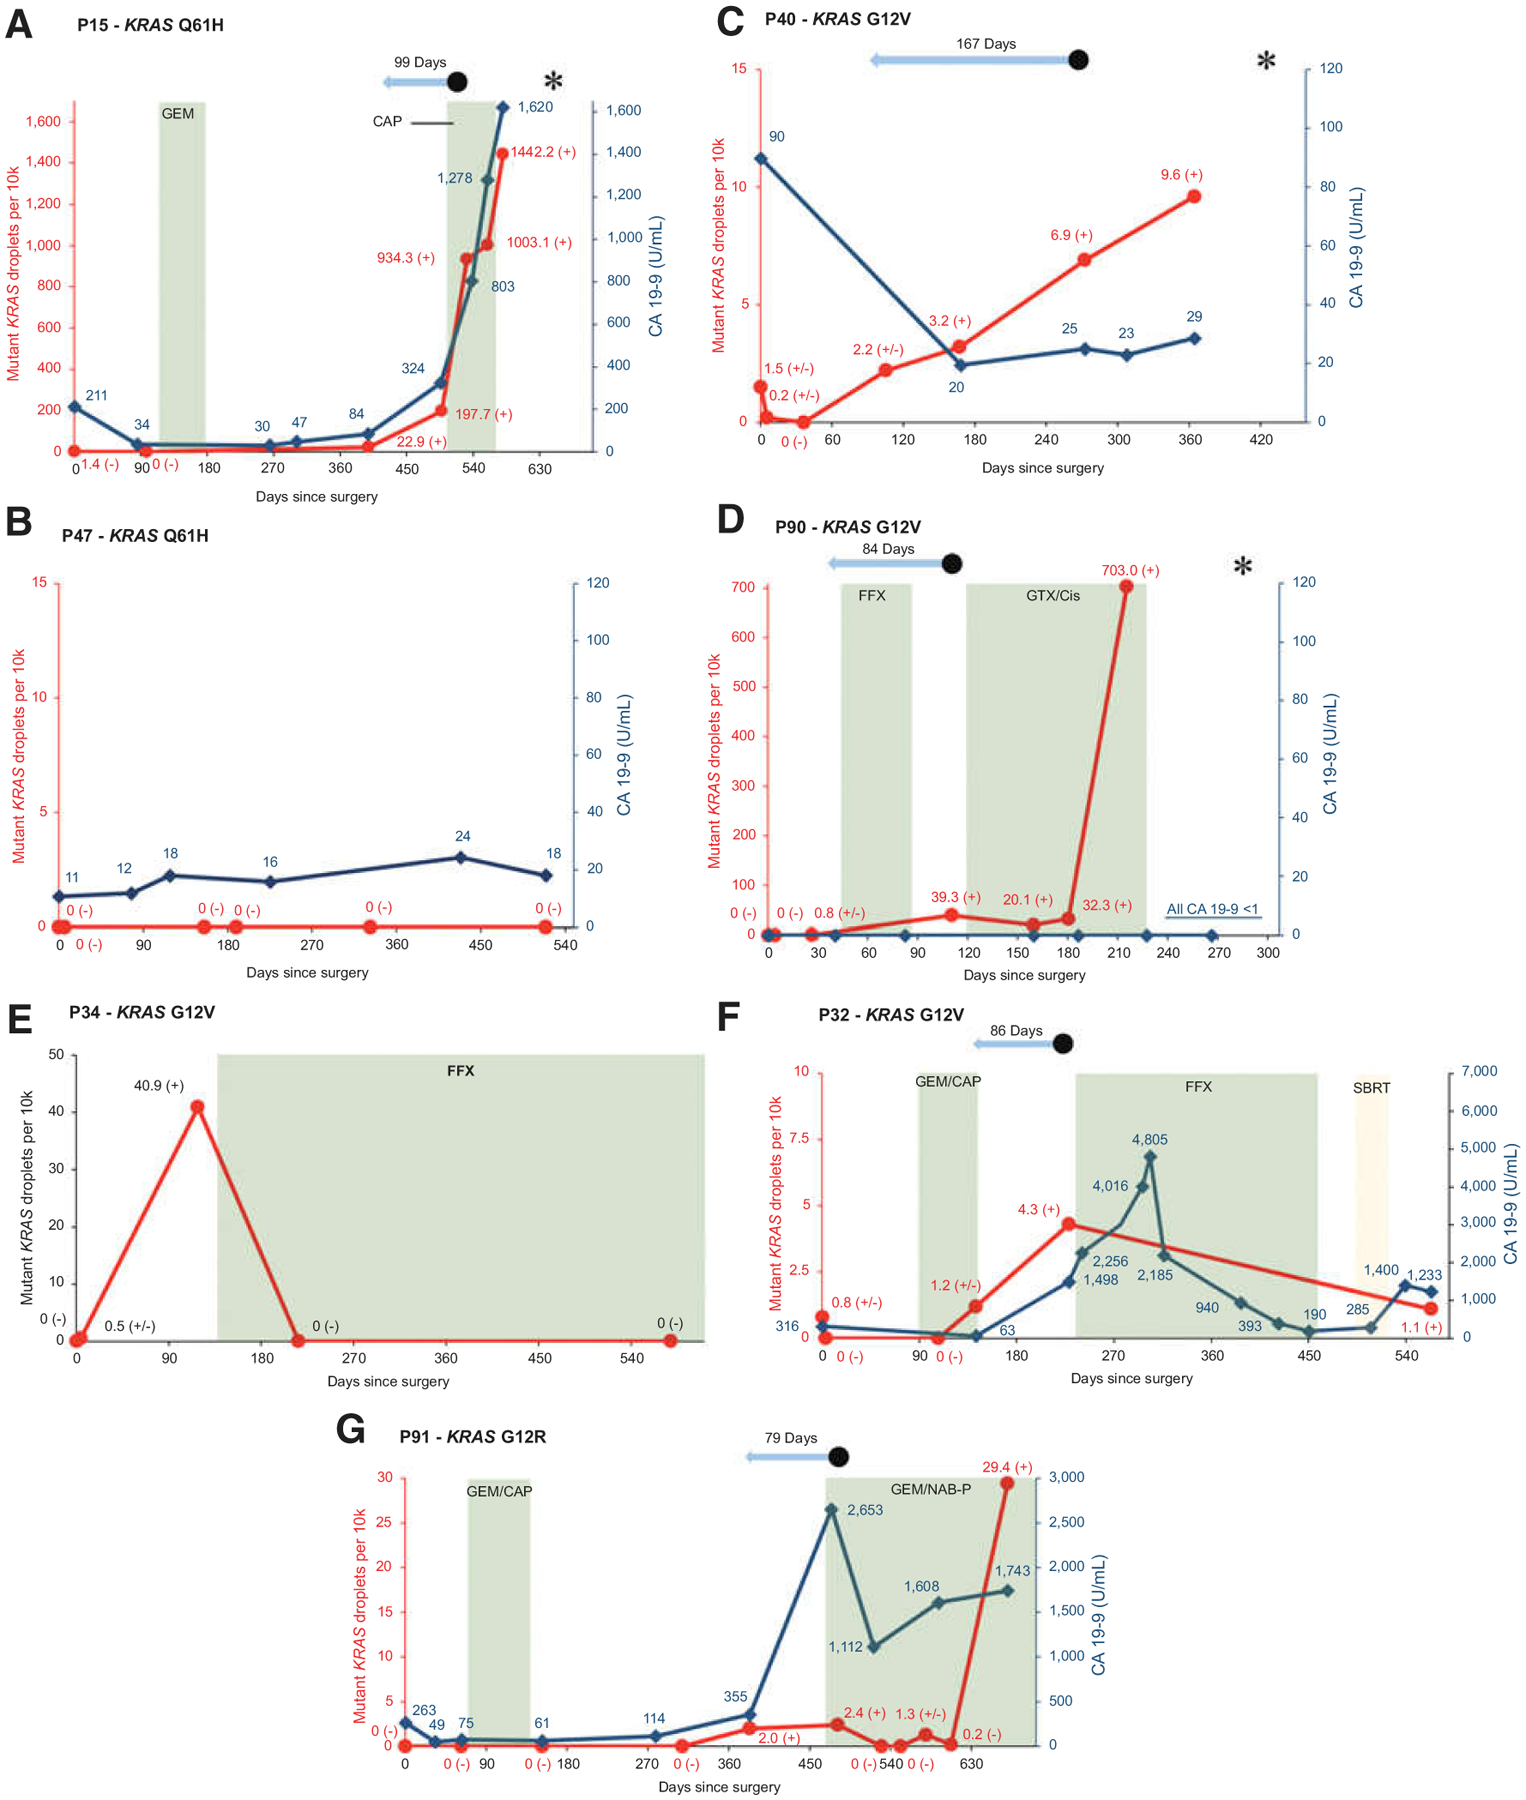
Figure 4.

Examples of individual patient graphs showing matching rise in CA 19–9 and KRAS ctDNA in a patient with recurrence (A), similar stability in CA 19–9 and KRAS ctDNA in a patient without recurrence (B), rise in KRAS ctDNA with low and stable CA 19–9 in a patient with recurrence (C), rise in KRAS ctDNA in nonexpressor of CA 19–9 with recurrence (D), KRAS ctDNA response to treatment (E and F), and a patient in whom KRAS ctDNA might have helped clinical decision-making (G).  Red line signifies mutant KRAS droplets per 10k total droplets over time.
  Dark blue line signifies CA 19–9 levels in U/mL over time.
  Green plane signifies chemotherapy treatment. CAP, capecitabine; FFX, FOLFIRINOX; GEM, gemcitabine; GTX/Cis, gemcitabine, docetaxel, capecitabine and cisplatin; NAB-P; nab-paclitaxel.
  Yellow plane signifies radiotherapy. SBRT, stereotactic body radiation therapy.
  Light blue arrow signifies lead time of KRAS ctDNA detection relative to clinical recurrence. • signifies clinical disease recurrence; * signifies patient death; (−) signifies a negative KRAS ctDNA result; (±) signifies a borderline KRAS ctDNA result; (+) signifies a positive KRAS ctDNA result. Sample at time point 0 represents the preoperative sample.
