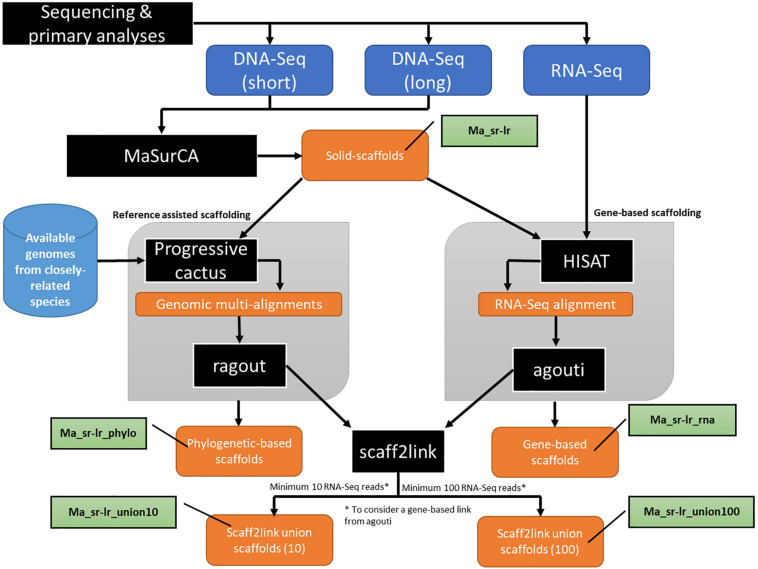
FIGURE 2.
Schematic presentation of the main analytical steps of the assembly workflow of Pteropus medius genome. Analytic steps, including the applied software (MaSurCa, HISAT, Progressive cactus AGOUTI and Scaff2link) are marked in black, input data in dark blue, data obtained from databases in light blue, nomenclature used for produced assemblies in green and produced data in orange.

