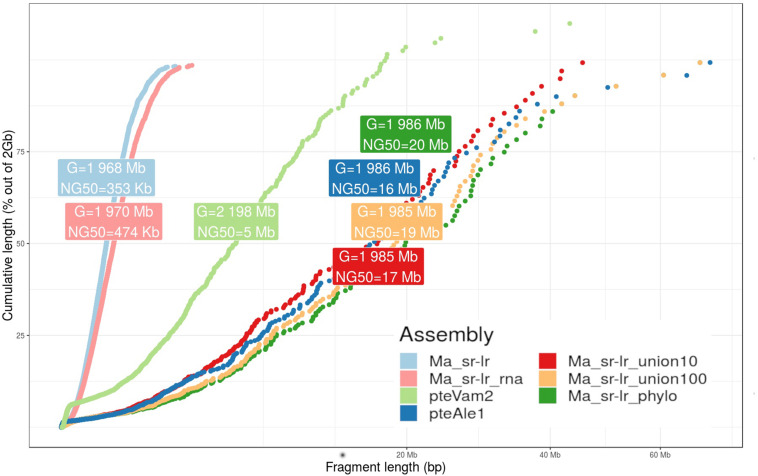
FIGURE 3.
Fragmentation graph for produced assemblies. The graph presents a scatter plot comparing cumulative length (y-axis) and the fragment length (x-axis) for four different P. medius scaffold assemblies, compared with already published P. vampyrus (pteVam2) and P. alecto (pteAleI). For each assembly, cumulative lengths were computed along sorted fragments, from the smallest to the highest. A label box gives information about the total size of the assembly (G) and the NG50 values, where the genome size has been set to 2 Gb for normalization.

