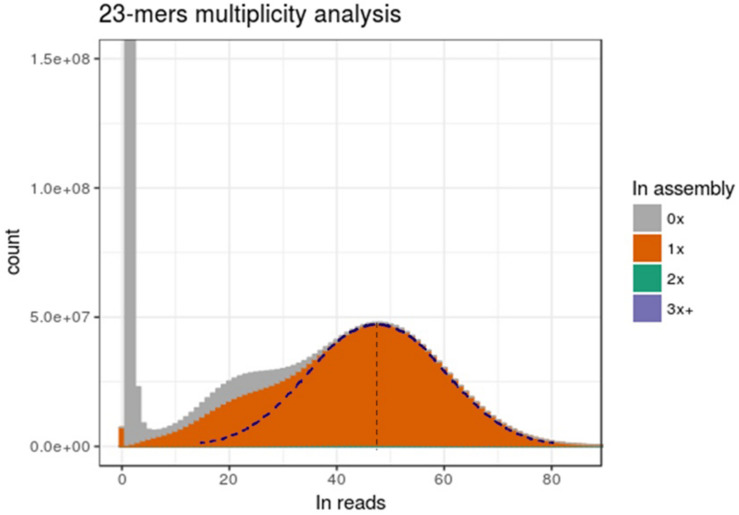
FIGURE 5.
Genome assembly is representative of only one allele. The x-axis presents the multiplicity of a k-mers. The y-axis is the amount of distinct k-mers present at this multiplicity in reads. Fill colors represent the number of time (0x, 1x, 2x or 3x, and more) a distinct k-mer is present in assembly. The right part of the dotted Gaussian curve has been hand-traced and a symmetry has been applied to get the left part.

