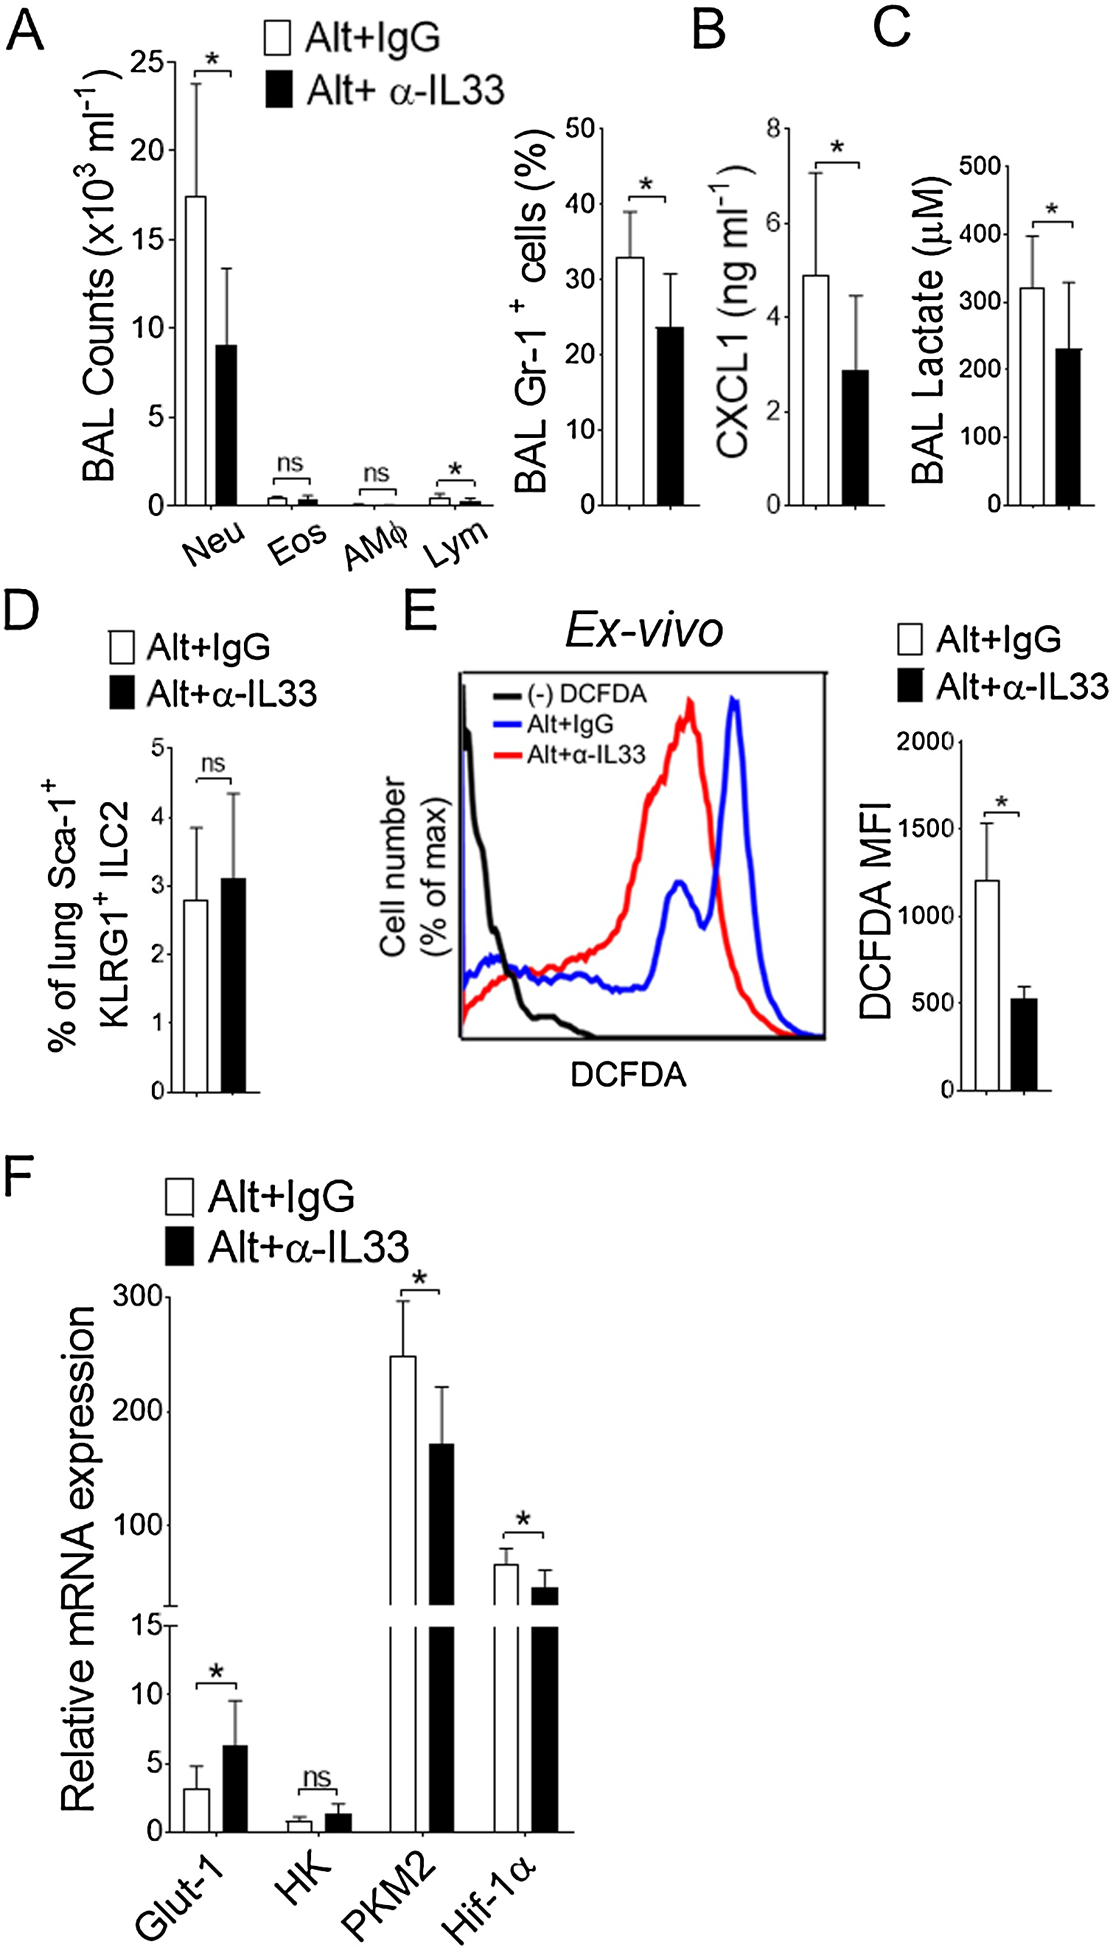
Figure 2. Alternaria-induced upregulation of glycolysis in lung APCs are IL-33 dependent.

(A) Differential cell counts and percentages of Gr-1+ neutrophils (right) in BAL as measured by flow cytometry. (B) CXCL1 and (C) lactate levels in BAL. (D) Bar graph of mean percentages of lung ILC2 and (E) representative FACS plots (left) and mean fluorescence intensity (MFI) ± s.d. (right) showing endogenous reactive oxygen species (ROS) level in isolated lung CD11c+ cells from isotype IgG or anti-IL33 (50 μg in 40 μl PBS, i.n., administered twice at 12 hour interval) treated mice. Results are from Alternaria-inflamed lungs at 6 hour. (F) qRT-PCR analyses of glycolytic genes in isolated lung CD11c+ cells and expressed as mean ± s.d. n = 5–10 per group. Student’s t test *, P< 0.05. IgG, Isotype IgG; α-IL33, mouse anti- IL33 antibody. Alt, Alternaria; Neu, Neutrophils; Eos, Eosinophils; AMΦ, Alveolar Macrophage; Lym, Lymphocytes.
