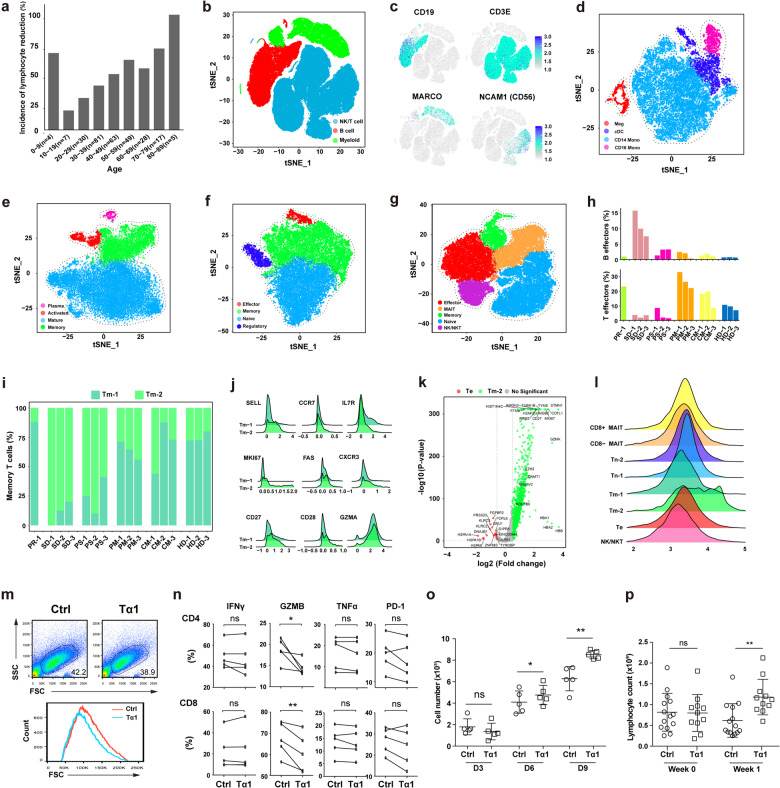
Fig. 1. Dysregulated adaptive immune responses in severe COVID-19.
a Bar plot showing the incidence of lymphocyte reduction in patients of different age groups. b The t-SNE plot showing the three main clusters: NK/T cells (blue color), B cells (red color) and myeloid cells (green color). c The expression of selected B, T, myeloid and NK cell markers in all cells. The t-SNE plot showing clusters in myeloid cells (d), B cells (e), CD4 T cells (f) and NK/CD8 T cells (g). h The proportion of B and T effectors in lymphocytes of each patient. i The proportion of Tm-1 and Tm-2 in each patient. j The ridgeline plot visualizing expression distributions of differentially expressed genes in Tm-1 and Tm-2 cells. k Volcano plot showing differentially expressed genes between Te and Tm-2 cells. Red and green dots represent significantly upregulated genes in Te and Tm-2 cells respectively (|log2(FC)| > 0.58, P < 0.05). l The ridgeline plot visualizing expression distributions of PTMA in NK/CD8 T cell subsets. m T cell sizes at day 3 post-activation. n Expression of IFNγ, GZMB, TNFα and PD-1 in CD4 and CD8 T cells at day 3 post-activation. o T cell numbers on day 3, 6 and 9 post-activation. p Lymphocyte counts of SARS-CoV-2 patients treated with or without Tα1. Conventional therapy (Ctrl) n = 14, Tα1 treatment n = 11, *P < 0.05, **P < 0.01.

