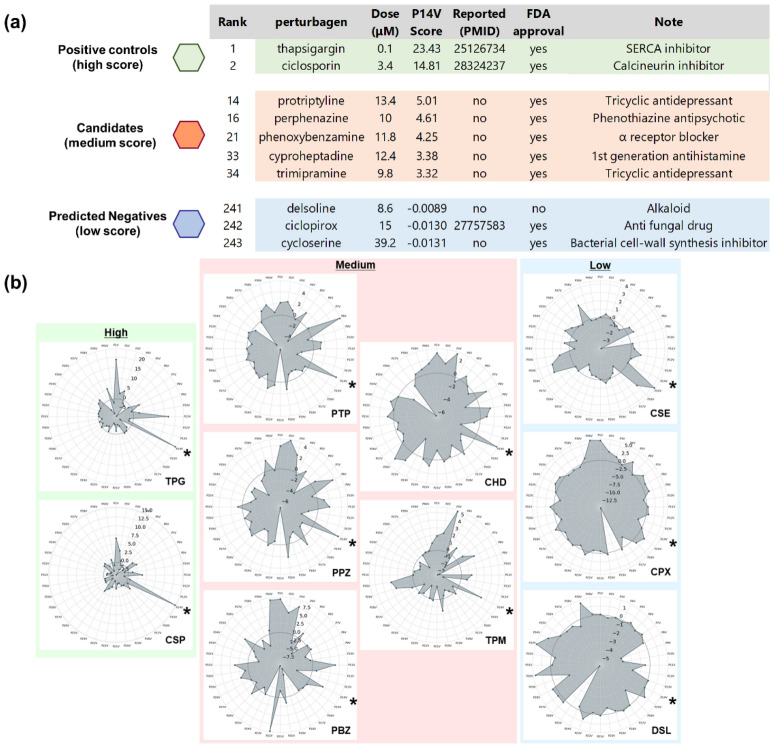
Figure 2.
Selection of test drugs and decomposition analysis. (a) List of the candidate drugs and control chemicals. Candidate drugs were selected and listed based on the following criteria: (1) drugs with a moderate score defined as median plus 0.75 times IQR of P14V score distribution, (2) no publications related to ER stress or UPR stress, and (3) drugs approved by FDA for oral use. Three compounds with low absolute values for P14V score (the bottom three compounds) were also selected as predicted negative compounds. (b) Decomposition analysis of each chemical. Radar chart visualizing OLSA outputs of the selected compounds. Direction indicates each vector score. Central black line is the line representing zero score. TPG, thapsigargin; CSP, ciclosporin A; PTP, protriptyline; PPZ, perphenazine; PBZ, phenoxybenzamine; CHD, cyproheptadine; TPM, trimipramine; DSL, delsoline; CPX, ciclopirox; CSE, cycloserine. Vectors are arranged clockwise with the top being P1V. *, P14V.

