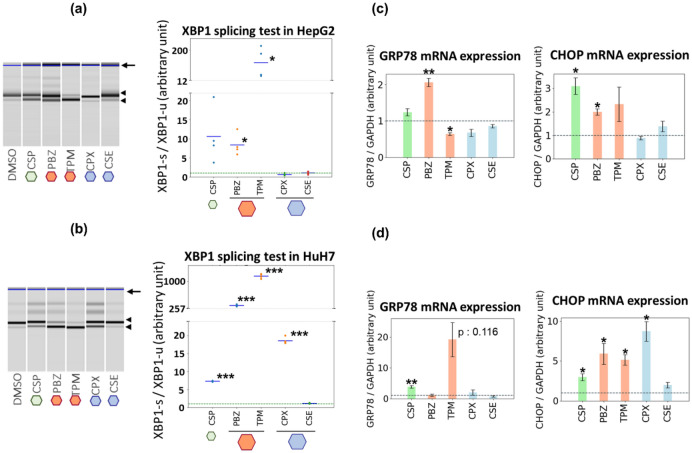
Figure 4.
Induction of ER stress in hepatic cancer-derived cell lines by representative test compounds. (a,b) XBP1 splicing test of HepG2 and HuH7 cells treated with the representative drugs. HepG2 and HuH7 cells were treated with the candidate drugs for 6 h at X-times the concentration used for transcriptome data acquisition. X: CSP, 1; PBZ, 10; TPM, 10; CPX, 10; CSE, 10. cDNA was synthesized from mRNA and subjected to conventional PCR. The concentrations of spliced and unspliced XBP1 amplified products were quantified using a MultiNA electrophoresis apparatus. The arrow, the upper arrowhead, and the lower arrowhead indicate a non-specific band, the unspliced XBP1, and the spliced XBP1, respectively. Each value in the lower graph indicates a ratio of spliced to unspliced XBP1. (c,d). Changes in expression of mRNA for ER stress markers in HepG2 and HuH7 cells. HepG2 and HuH7 cells were treated with the candidate drugs for 24 h at X-times the concentration used for transcriptome data acquisition. X: CSP, 1; PBZ, 3; TPM, 3; CPX, 10; CSE, 10. cDNA was synthesized from mRNA and subjected to quantitative PCR analysis. A representative result of at least two independent experiments is shown in each figure. All significance tests were conducted using Welch’s t test, P values were adjusted for FDR (Benjamini–Hochberg method), and only significant differences between DMSO and the tested compounds are shown: *P < 0.05, **P < 0.01, ***P < 0.001.

