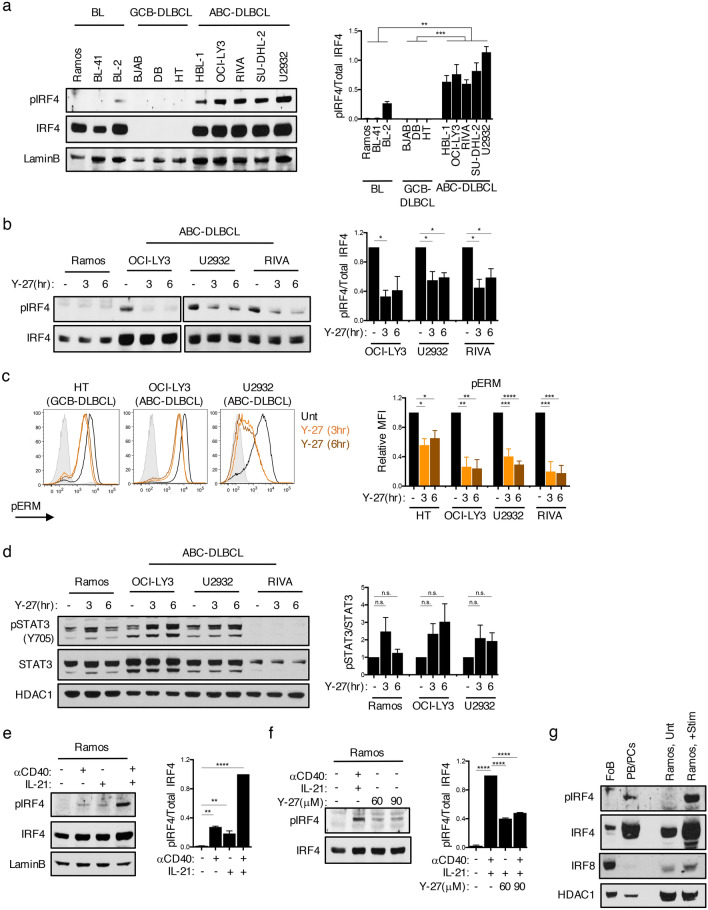
Figure 1.
IRF4 is constitutively phosphorylated in ABC-DLBCL. (a) Representative immunoblot and quantifications of phosphorylated IRF4 at S446/S447 (pIRF4), total IRF4, and LaminB from nuclear extracts of BL (Ramos, BL-41, BL-2), GCB-DLBCL (BJAB, DB, HT), and ABC-DLBCL (HBL-1, OCI-LY3, RIVA, SU-DHL-2, U2932) cells. Quantifications are calculated as the densitometry ratio between pIRF4 to total IRF4 (mean ± SEM; n = > 3 per cell line; p value by 1-way ANOVA followed by Tukey’s multiple comparisons test). (b) Representative immunoblot and quantifications of indicated proteins from nuclear extracts of cells either left untreated or cultured in the presence of 90 μM Y-27632 (Y-27), a pan-ROCK inhibitor. Blot separation indicates different exposures of the same blot. Quantifications are calculated as in (a) (mean ± SEM; n = > 2 per cell line; p value by 1-way ANOVA followed by Dunnett’s multiple comparisons test). (c) Representative histograms and quantifications of phosphorylated ERM (pERM) expression in DLBCL cells either left untreated or following treatment with 90 μM Y-27 (mean ± SEM; n = > 3; p value by 1-way ANOVA followed by Dunnett’s multiple comparisons test). (d) Representative immunoblot and quantifications of phosphorylated STAT3 (pSTAT3; Y705), total STAT3, and HDAC1 from nuclear extracts of cell lines either left untreated or cultured with Y-27 as in (b). Quantifications are calculated as the densitometry ratio of pSTAT3 to total STAT3 (mean ± SEM; n = 2; p value by 1-way ANOVA followed by Dunnett’s multiple comparisons test). (e) Representative immunoblot and quantifications of indicated proteins from nuclear extracts of Ramos cells treated for 6 h with various combinations of αCD40 and IL-21. Quantification is calculated as in (a) (mean ± SEM; n = 2; p value by 1-way ANOVA followed by Dunnett’s multiple comparisons test). (f) Representative immunoblot and quantifications of indicated proteins from nuclear extracts of Ramos cells pre-treated for 2 h with Y-27 before stimulation as in (e). Quantification is calculated as in (e) (mean ± SEM; n = 2; p value by 1-way ANOVA followed by Tukey’s multiple comparisons test). (g) Representative immunoblot of indicated proteins from lysates of sorted follicular B-cells (FoBs; Blimp1-yfp−CD138-B220+CD23+) or plasmablasts/plasma cells (PB/PCs; Blimp1-yfp+CD138+) from Blimp1-yfp reporter mice at d7 post-immunization with 100 μg NP-CGG. Ramos cells were used as a control. Data representative of 3 independent experiments. * p < 0.05, ** p < 0.01, *** p < 0.001, **** p < 0.0001.

