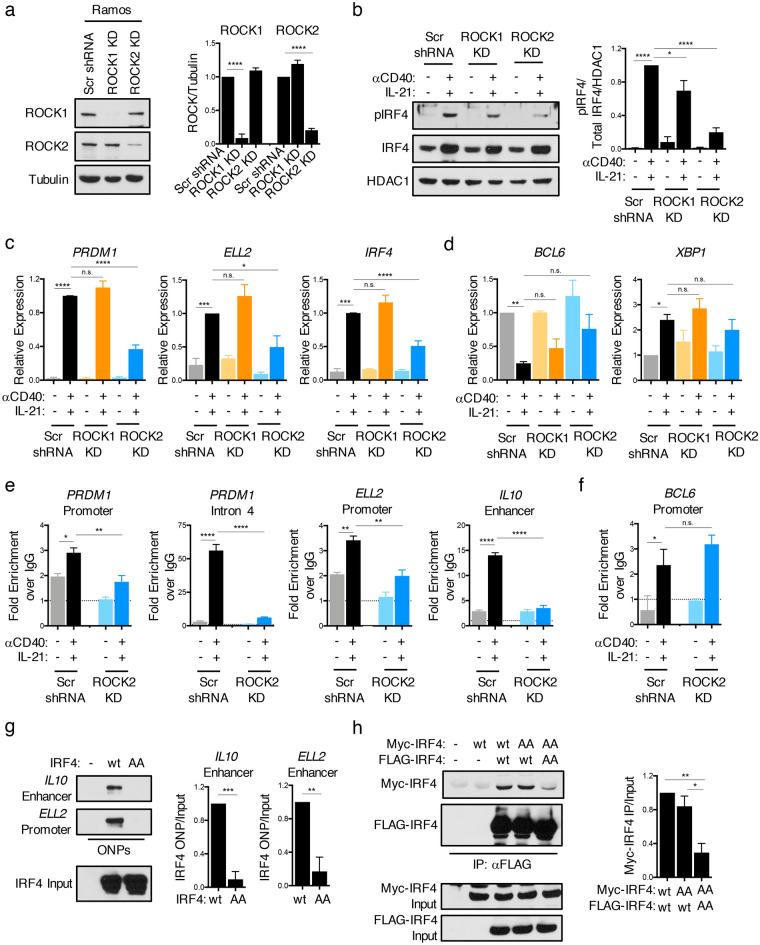
Figure 3.
ROCK2 regulates the expression of a subset of IRF4 target genes in stimulated B-cells. (a) Representative immunoblot and quantifications of ROCK1 and ROCK2 from lysates of Ramos cells after stable lentiviral infection with shRNA constructs targeting either ROCK1 (ROCK1 KD), ROCK2 (ROCK2 KD), or with a scrambled shRNA control (Scr shRNA). Quantifications are calculated as the densitometry ratio between each ROCK protein to β-Tubulin (mean ± SEM; n = 3; p value by 1-way ANOVA followed by Dunnett’s multiple comparisons test). (b–f) Stable Ramos ROCK1 KD (orange), ROCK2 KD (blue), and Scr (black) control cells were left untreated or stimulated for 6 h with αCD40 and IL-21. (b) Representative immunoblot and quantifications of pIRF4 and total IRF4 from nuclear extracts of stable Ramos ROCK KD cells. Quantifications are calculated as the densitometry ratio between pIRF4 to the ratio of total IRF4 to HDAC1 (mean ± SEM; n = 3; p value by 1-way ANOVA followed by Dunnett’s multiple comparisons test). (c–d) Pooled RT-qPCR analysis of indicated transcripts (mean ± SEM; n = 4; p value by 1-way ANOVA followed by Dunnett’s multiple comparisons test). (e–f) Representative ChIP-qPCR analysis of IRF4 binding to regulatory regions in the PRDM1, ELL2, IL10, and BCL6 loci (mean ± SD; n = 2; p value by 1-way ANOVA followed by Dunnett’s multiple comparisons test). (g) Oligonucleotide precipitation assays (ONPs) of extracts from 293 T cells transfected with wt or phosphomutant (AA) IRF4, assessed with biotinylated oligonucleotides from the IL10 enhancer or the ELL2 promoter region, followed by immunoblot of precipitated IRF4. Quantifications are calculated as the densitometry ratio between IRF4 precipitated during the ONP to input IRF4 levels (mean ± SEM; n = 3; p value by unpaired t test). (h) 293 T cells were co-transfected with MYC-tagged IRF4-wt or MYC-tagged IRF4-AA and either FLAG-tagged IRF4-wt or FLAG-tagged IRF4-AA as indicated. Immunoprecipitations were performed using an anti-FLAG antibody and analyzed by immunoblotting. Quantifications are calculated as the densitometry ratio between precipitated MYC-tagged IRF4 protein to input MYC-tagged IRF4 (mean ± SEM; n = 3; p value by 1-way ANOVA followed by Tukey’s multiple comparisons test). * p < 0.05, ** p < 0.01, *** p < 0.001, **** p < 0.0001.

