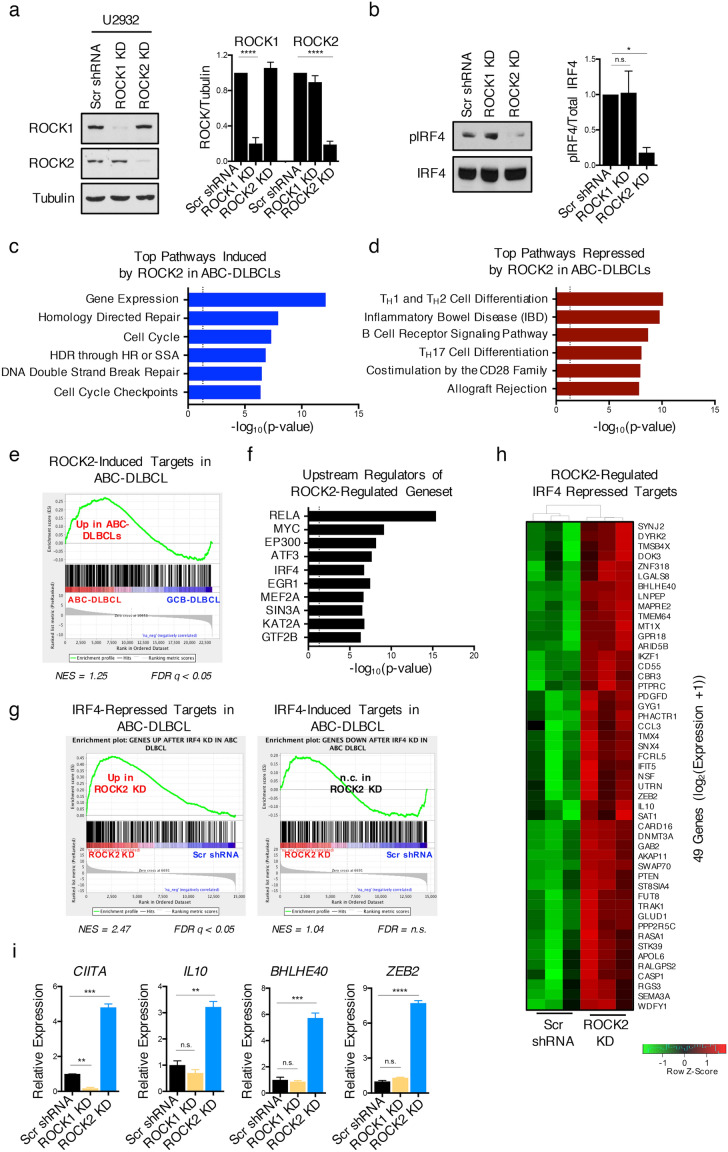
Figure 4.
ROCK2 regulates the expression of IRF4-repressed targets in ABC-DLBCL. (a) Representative immunoblot and quantifications of ROCK1 and ROCK2 from lysates of U2932 cells after stable lentiviral infection with shRNA expression constructs targeting either ROCK1 (ROCK1 KD), ROCK2 (ROCK2 KD) or with a scrambled shRNA control (Scr shRNA). Quantifications are calculated as the densitometry ratio between each ROCK protein to β-Tubulin (mean ± SEM; n = 4; p value by 1-way ANOVA followed by Dunnett’s multiple comparisons test). (b) Representative immunoblot and quantifications of phosphorylated IRF4 at S446/S447 (pIRF4) and total IRF4 from nuclear extracts of stable U2932 ROCK KD cells. Quantifications are calculated as the densitometry ratio between pIRF4 to total IRF4 (mean ± SEM; n = 5; p value by 1-way ANOVA followed by Dunnett’s multiple comparisons test). (c–g) RNA-seq analysis was performed on U2932 ROCK2 KD cells. (c–d) Plots showing the -log10 (p value) values for the top over-represented pathways from the genes induced (c) or repressed (d) by ROCK2 in U2932. Dotted lines indicate significance cutoffs at p = 0.05. (e) GSEA plot showing the significant enrichment of the ROCK2-induced geneset from U2932 (Table S1) in primary ABC-DLBCL cases. (f) Plot showing the top enriched upstream regulators of the ROCK2-regulated geneset in U2932 using EnrichR analysis. Dotted line indicates significance cutoff at p = 0.05. (g) GSEA plot showing the significant enrichment of previously defined IRF4-repressed and IRF4-induced genesets from ABC-DLBCLs in U2932 ROCK2 KD cells. (h) Heat map depiction of target genes identified in (f) that are contributing to the enrichment of the “IRF4-repressed targets in ABC-DLBCL” pathway and are differentially expressed in U2932 ROCK2 KD cells. (i) Representative RT-qPCR analysis of the indicated genes in U2932 ROCK1 KD (orange), ROCK2 KD (blue), or scrambled shRNA control cells (black). Data representative of 3 independent experiments (mean ± SD; p value by 1-way ANOVA followed by Dunnett’s multiple comparisons test). * p < 0.05, ** p < 0.01, *** p < 0.001, **** p < 0.0001.

