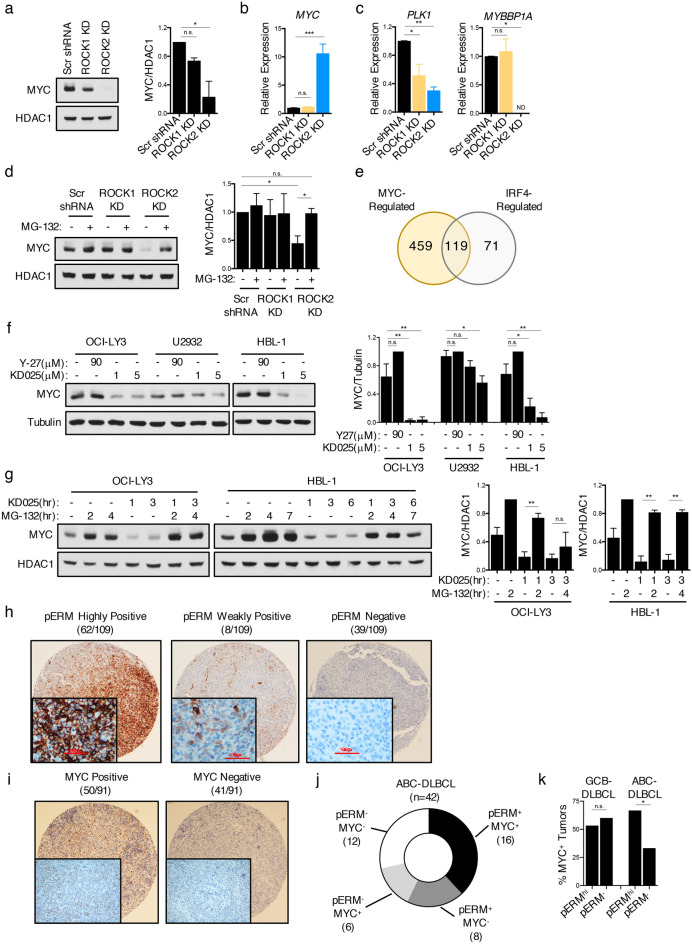
Figure 5.
ROCK2 regulates the levels of MYC Protein in ABC-DLBCL. (a–d) Stable ROCK knockdowns were generated in U2932 cells following lentiviral infection with shRNA constructs as in Fig. 4. (a) Representative immunoblot and quantifications of MYC expression. Quantifications are calculated as the densitometry ratio between MYC to HDAC1 (mean ± SEM; n = 2; p value by 1-way ANOVA followed by Dunnett’s multiple comparisons test). (b–c) Pooled RT-qPCR analysis of indicated genes from U2932 ROCK2 KD (blue), ROCK1 KD (orange) and scrambled shRNA control (black) cells (mean ± SEM; n = 3; p value by 1-way ANOVA followed by Dunnett’s multiple comparisons test). (d) Representative immunoblot and quantifications of MYC expression from nuclear extracts of U2932 ROCK KD cells left untreated or following treatment with 5 μM MG-132 for 2 h. Quantifications are calculated as the densitometry ratio between MYC to HDAC1 (mean ± SEM; n = 3; p value by unpaired two-tailed t tests). (e) Venn diagram showing the overlap of IRF4 and MYC targets from the EnrichR upstream regulator analysis on the U2932 ROCK2-regulated geneset in Fig. 4e. (f) Representative immunoblot and quantifications of MYC expression from extracts of DLBCL cells treated for 6 h with Y-27 or KD025 as indicated. Blot separation indicates experiments run on separate gels. Quantifications are calculated as the densitometry ratio between MYC to β-Tubulin (mean ± SEM; n = 3; p value by 1-way ANOVA followed by Dunnett’s multiple comparisons test). (g) Representative immunoblot and quantifications of MYC expression from nuclear extracts of DLBCL cells pre-treated with 5 μM MG-132 for 1 h prior to treatment with 5 μM KD025 for the indicated times. Blot separation indicates experiments run on separate gels. Quantifications are calculated as in (d) (mean ± SEM; n = 3; p value by unpaired two-tailed t tests). (h–i) Immunohistochemistry of pERM (h) and MYC (I) on primary DLBCL TMAs. (J) Plot showing the frequency of ABC-tumors expressing both pERM and MYC. (k) Plot showing the percentage of MYC-positive tumors among pERM+ and pERM- tissues in GCB-DLBCL and ABC-DLBCL cases. Statistics based on z-test to compare the total numbers of cases in each subgroup. * p < 0.05, ** p < 0.01, *** p < 0.001, **** p < 0.0001.

