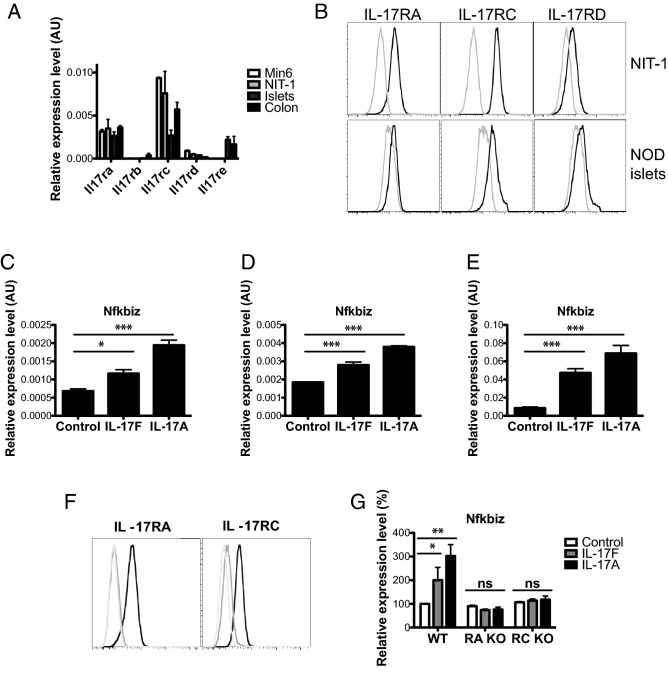
Figure 1.
Pancreatic β-cells respond to IL-17F signals via IL-17RA and -RC. (A) Total RNA was isolated from Min6, NIT-1, pancreatic islets and colon tissue and the expression of Il17ra-e measured by Taqman quantitative RT-PCR. (B) NIT-1 cells and primary NOD islets were stained with antibodies against IL-17RA, RC and RD and cell surface expression quantified using flow cytometry (black line = antibody stained, grey line = unstained control). (C) NIT-1 cells were stimulated with IL-17F or IL-17A for 2 h and Nfkbiz expression measured by Taqman quantitative RT-PCR (n = 4 for all groups), p < 0.05 (*), p < 0.001 (***) One-Way ANOVA with Bonferonni’s Multiple Comparison test. (D) Min6 cells were stimulated with IL-17F or IL-17A for 4 h and Nfkbiz expression measured by Taqman quantitative RT-PCR (n = 4 for all groups), p < 0.001 (***) One-Way ANOVA with Bonferonni’s Multiple Comparison test. (E) NOD islets were stimulated with IL-17F or IL-17A for 4 h and Nfkbiz expression measured by Taqman quantitative RT-PCR (n = 3 for all groups), p < 0.001 (***) One-Way ANOVA with Bonferonni’s Multiple Comparison test. (F) IL-17RA knockout (left panel) and RC knockout (right panel) NIT-1 cells were generated with CRISPR/Cas9 and stained with antibodies against IL-17RA (left panel) and RC (right panel) (black = parental control cell line, grey = receptor knockout cell line, light grey = unstained control). (E) Wildtype, IL-17RA KO and IL-17RC KO NIT-1 cells were stimulated with IL-17F or IL-17A for 2 h and Nfkbiz expression measured by Taqman quantitative RT-PCR (n = 2 for all groups), p < 0.05 (*), p < 0.01 (**) Two-Way ANOVA with Bonferonni’s Multiple Comparison test.

