Figure 1.

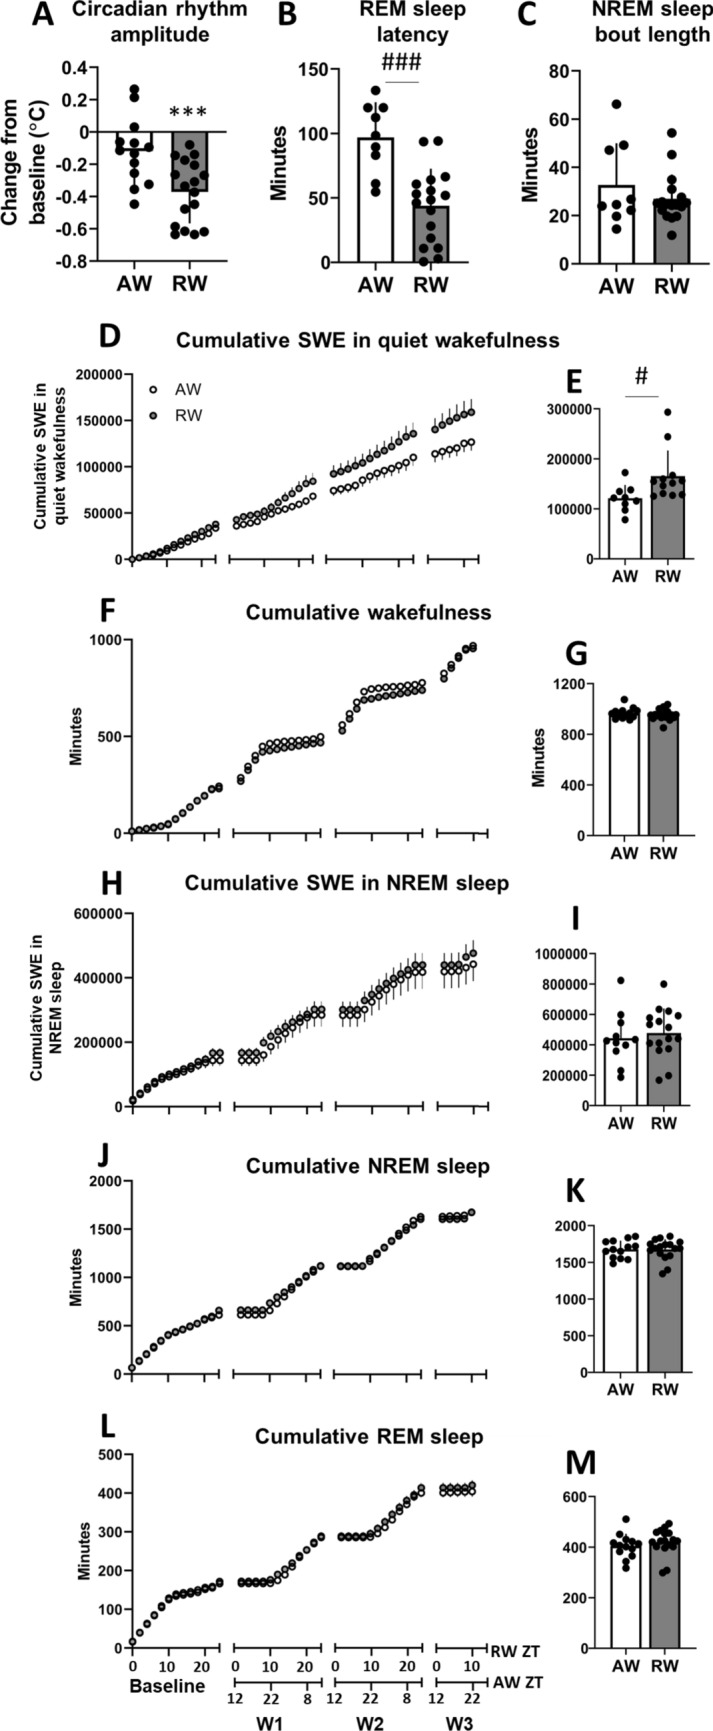
Daily rhythm, sleep and wake parameters in active workers (AW) and rest workers (RW). (A) Body temperature rhythm amplitude during the 3-day work schedule relative to baseline. Body temperature rhythm was estimated with cosinor analysis. (B) Latency to rapid eye movement (REM) sleep after the 2nd work shift. (C) Mean length of non-REM (NREM) sleep bouts during the 3-day work period. (D,H) Cumulative slow wave energy (SWE, total integrated power in the 1–4 Hz frequency range) in quiet wakefulness and NREM sleep. (F,J,L) Cumulative wakefulness, NREM sleep and REM sleep, respectively. All cumulative data are expressed per 2 h during baseline and 3-day work schedule; workday 1 (W1) to W3 in RW (work hours: zeitgeber time, ZT2-10) and AW (work hours: ZT14-22). (E,I) Total SWE in quiet wakefulness and NREM sleep, respectively, in AW and RW during the 3-day work period. (G,K,M) Total time in wakefulness, NREM sleep and REM sleep, respectively, in AW and RW during the 3-day work period. Bar plots show mean ± SEM, with scatter plot overlaid. N = 9–17/group. ***p < 0.001, compared to baseline. #p < 0.05, ###p < 0.001, between groups.
