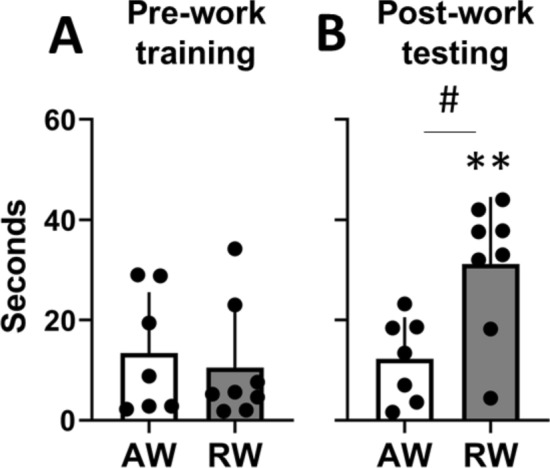
Figure 2.

Latency to platform on the Morris Water Maze task, for active workers (AW) and rest workers (RW). (A) The last training trial before commencing the 3-day work period. Training occurred around zeitgeber time, ZT6. (B) The first testing trial immediately after the third work shift, AW at ZT20, RW at ZT10. Plots show mean ± SEM, with scatter plot overlaid. N = 7–8/group. **p < 0.01, compared to pre-work training. #p < 0.05, between groups.
