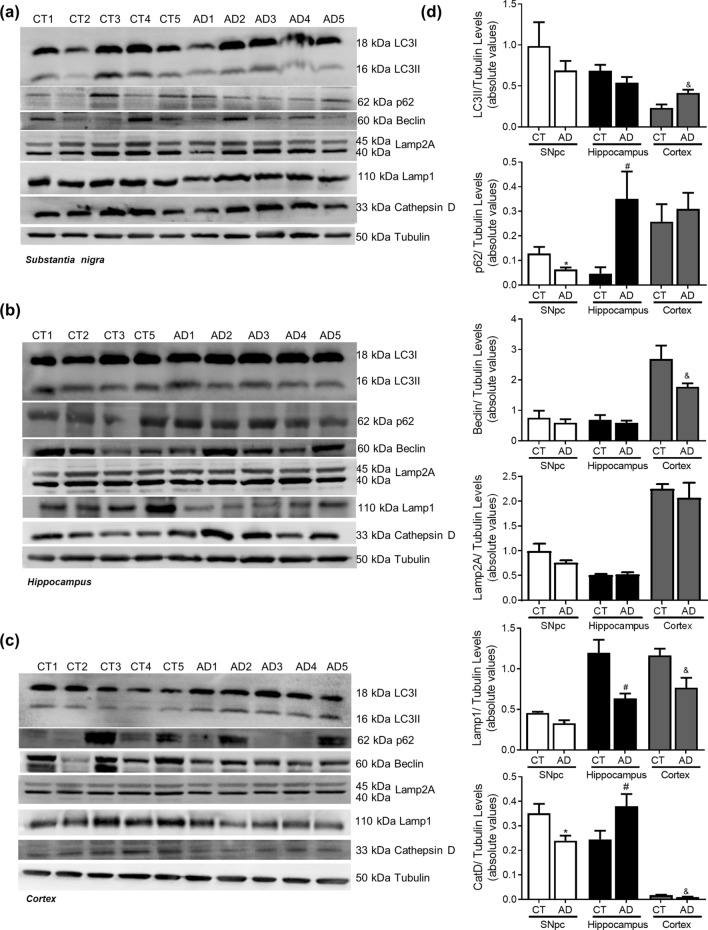
Figure 7.
Autophagic-lysosomal pathway in AD. Autophagic and lysosomal markers were determined in post-mortem human brain samples from SNpc, Hippocampus and Cortex of sporadic AD patients and controls. The levels of LC3II, p62, Beclin1, Lamp2A, Lamp1 and CatD were determined in: (A) SNpc; (B) Hippocampus and (C) Cortex brain tissue homogenates. (D) Densitometric analysis of the levels of LC3II, p62, Beclin1, Lamp2A, Lamp1 and CatD. The blots were re-probed for α-tubulin to confirm equal protein loading Values are mean ± SEM (n = 5–6, *p < 0.05, versus SNpc control subjects; #p < 0.05, versus hippocampus control subjects; and &p < 0.05, versus cortex control subjects). Full length blots are presented in the Supplementary Information.

