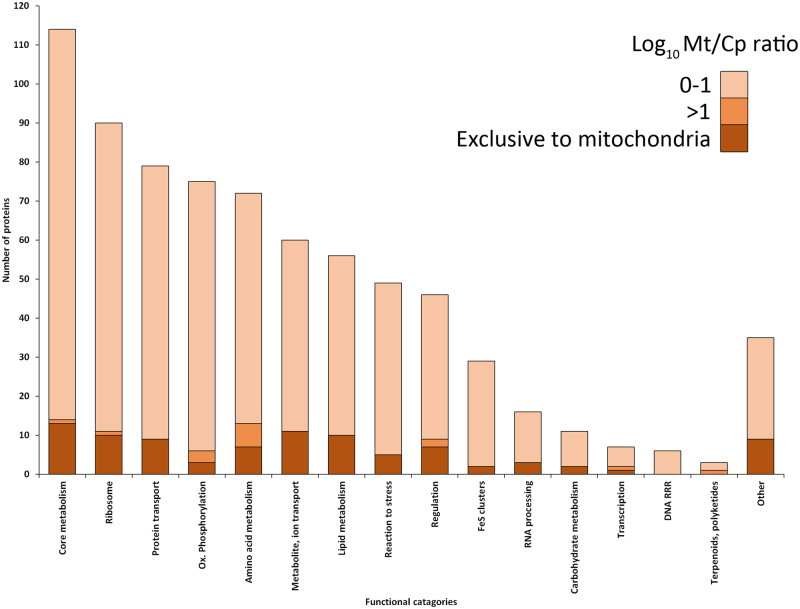
Fig. 2.
Functional categories of 743 mitochondrially enriched transcripts with predicted function (42% of the entire proteome) including the logarithmic enrichment ratio of the mitochondrial versus chloroplast preparation (log 10MT/CP) ratio for each category, shown in shades of orange (infinite, 0–1 representing 1–10× greater protein amount in mitochondrial fraction, 1–2 for 10–100×; full category names are listed in Materials and Methods).

