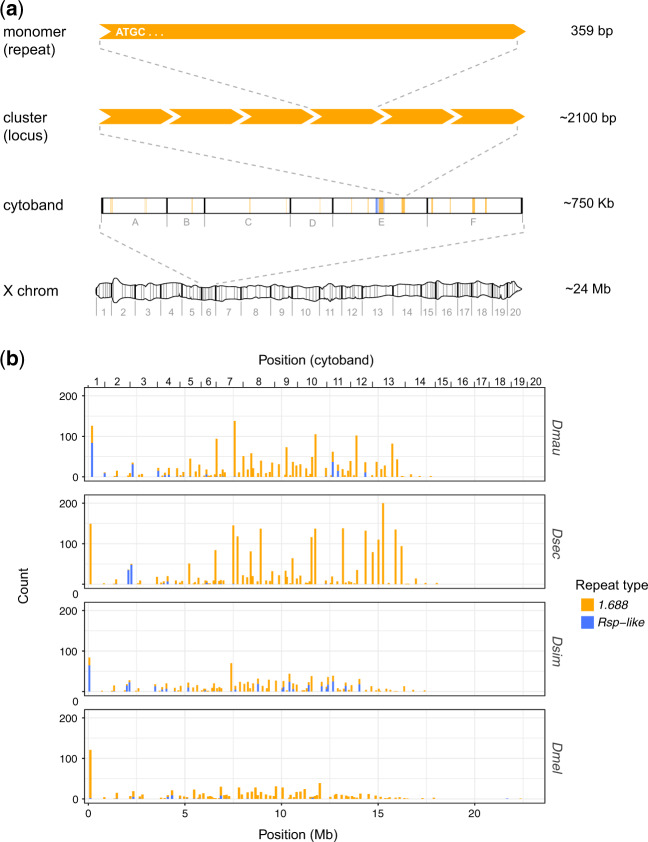
Fig. 1.
Euchromatic X-linked satellites are unevenly distributed across the X chromosome. (a) A schematic illustrating terms frequently used in the text. We use “cytoband” to reference large regions of the X chromosome that are defined by banding patterns in polytene chromosomes. The X Chromosome polytene graphic was redrawn based onBridges (1938) as a reference image. We use “cluster” to mean any distinct genomic locus containing the repeat of interest; typically >1 repeat. “Monomer” refers to a single repeat unit; the example shown represents a 1.688 monomer. (b) The x axis shows position of 1.688 and Rsp-like satDNA clusters along the X chromosome for each species. Each bar on the chart represents a cytological subdivision (e.g., 1A, 1B, etc.) in which counts of all repeats are pooled. The y axis indicates the number of repeat copies (i.e., monomers) within a subdivision.

