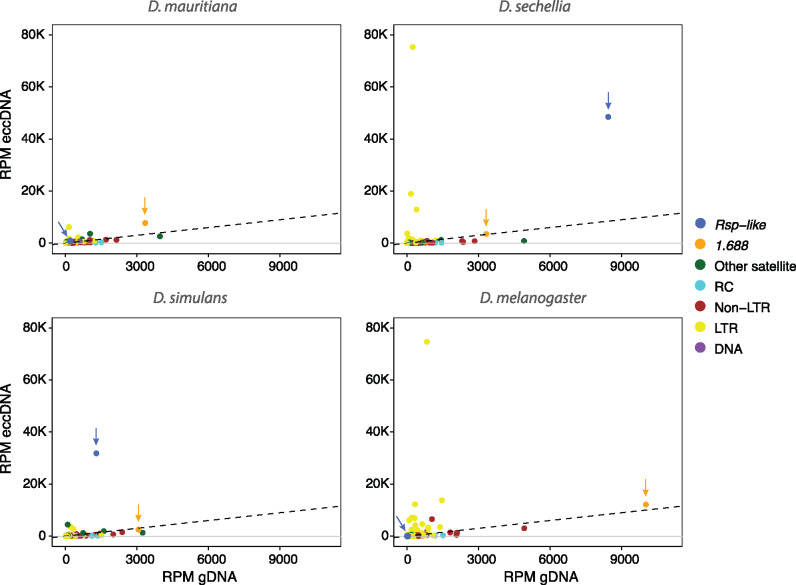
Fig. 7.
Scatter plot of eccDNA RPM and genomic DNA RPM. Repeats in the genome are categorized by color into: other satellite (complex satellites except 1.688 and Rsp-like), LTR retrotransposon, non-LTR retrotransposon, DNA transposon, and rolling-circle (RC) transposon. Rsp-like (shown in blue) and 1.688 (shown in orange) are indicated by arrows. Dotted lines represent the same abundance of eccDNA and genomic DNA such that dots above the dotted line indicate repeats that are enriched in eccDNA libraries relative to genomic controls.

