

Abstract
Different evolutionary forces shape gene content and sequence evolution on autosomes versus sex chromosomes. Location on a sex chromosome can favor male-beneficial or female-beneficial mutations depending on the sex determination system and selective pressure on different sexual morphs. An X0 sex determination can lead to autosomal enrichment of male-biased genes, as observed in some hemipteran insect species. Aphids share X0 sex determination; however, models predict the opposite pattern, due to their unusual life cycles, which alternate between all-female asexual generations and a single sexual generation. Predictions include enrichment of female-biased genes on autosomes and of male-biased genes on the X, in contrast to expectations for obligately sexual species. Robust tests of these models require chromosome-level genome assemblies for aphids and related hemipterans with X0 sex determination and obligate sexual reproduction. In this study, we built the first chromosome-level assembly of a psyllid, an aphid relative with X0 sex determination and obligate sexuality, and compared it with recently resolved chromosome-level assemblies of aphid genomes. Aphid and psyllid X chromosomes differ strikingly. In aphids, female-biased genes are strongly enriched on autosomes and male-biased genes are enriched on the X. In psyllids, male-biased genes are enriched on autosomes. Furthermore, functionally important gene categories of aphids are enriched on autosomes. Aphid X-linked genes and male-biased genes are under relaxed purifying selection, but gene content and order on the X is highly conserved, possibly reflecting constraints imposed by unique chromosomal mechanisms associated with the unusual aphid life cycle.
Keywords: psyllid genome, Pachypsylla venusta, sexually antagonistic mutations, sex-biased genes, symbiosis-related genes, oxidative phosphorylation genes
Introduction
Distinct evolutionary forces act on genes on sex chromosomes versus those on autosomes (Bachtrog et al. 2011). For example, sexually antagonistic mutations, that is, those that favor fitness in one sex at the expense of the other (Gallach and Betrán 2011; Dean and Mank 2014), will be selected differently depending on whether they are located on autosomes, which occur equally in both sexes, or sex chromosomes, which differ in occurrence in males and females. Additionally, autosomes and sex chromosomes typically differ in effective population sizes and in mutational input, since the male germline often undergoes more replications and more associated mutations than the female germline (Li et al. 2002; Bachtrog 2008). These different forces can shape gene and genome evolution, with consequences for distributions of genes on chromosomes and gene sequence evolution. Consequently, rates of sequence evolution and levels of polymorphism often differ between sex chromosomes and autosomes, and locations of sexually antagonistic genes can be biased toward autosomes or sex chromosomes, depending on the sex determination system, the dominance of alleles, and the strength of selective forces (Rice 1984; Gurbich and Bachtrog 2008; Jaquiéry et al. 2013; Dean and Mank 2014).
Insects, the most species-rich group of animals, provide diverse sex determination systems to investigate the evolution of sex chromosomes. One of the most unusual situations affecting sex chromosome evolution occurs in aphids (Insecta: order Hemiptera: superfamily Aphidoidea). As in many hemipteran lineages, aphids have X0 sex determination, in which males possess one X and females have two. But in contrast to other hemipterans, aphids exhibit the rare feature of life cycles dominated by a succession of rapidly reproducing all-female asexual generations, with males and sexual females present only briefly. Specialized cytogenetic mechanisms underlie the asexual production of the X0 males from their XX mothers, and the production of all X sperm from the X0 males (Blackman and Spence 1996; Bizzaro et al. 2000; Manicardi et al. 2015). Males and sexual females mate and produce only XX daughters, which initiate another series of asexual generations.
One consequence of the aphid life cycle is that differences in effective population sizes and mutational input between sex chromosome versus autosomes are eliminated (Jaquiéry et al. 2012); another is that selection on asexual females is expected to be stronger than that on males, which are present only briefly (Brisson and Nuzhdin 2008). Jaquiéry et al. (2013) developed theory predicting the accumulation of sexually antagonist alleles on autosomes versus on the X, taking into account the all-female asexual phase of aphids. They found that location on the X chromosome favors the spread of alleles benefiting males, whereas location on autosomes favors alleles benefiting asexual females. Using relative expression levels in different morphs as an indicator of which morph is most affected by a particular locus and genomic sequencing depth in males versus females to assign genes to autosomes or the X chromosome, they found that indeed genes important in asexual females tend to occur on autosomes. A striking finding was the average low expression level and the high dN/dS (ratio of replacement to synonymous substitutions in protein-coding genes) of genes on the X, suggesting that genes under strong purifying selection are preferentially located on autosomes (Jaquiéry et al. 2018). Earlier cytogenetic observations also indicate that the X is enriched in repetitive sequences (e.g., Bizzaro et al. 2000), a finding confirmed by chromosome-scale assembly of the aphid genomes (Li et al. 2019).
Many hemipteran species have X0 sex determination, but most are obligately sexual. In some X0 hemipteran species, genes with male-biased expression appear to be enriched on autosomes (Pal and Vicoso 2015). However, to date, genomic data for hemipterans have been available only for aphids and for species representing distant lineages in other suborders, diverging from aphids 350 to 400 Ma (Pal and Vicoso 2015). Closer relatives of aphids (Aphidoidea) include the three other superfamilies within the suborder Sternorrhyncha: scale insects (Coccoidea), whiteflies (Aleyrodoidea), and psyllids (Psylloidea). Whereas scale insects and whiteflies have various sex determination systems, including haplodiploidy, psyllids share X0 sex determination with aphids but lack an asexual phase. Therefore, psyllids are ideal comparisons for further tests of the consequences of intermittent asexuality for sex chromosome evolution. Predictions include enrichment of male-biased genes on the X and enrichment of female-biased genes on autosomes in aphids but not in psyllids (Jaquiéry et al. 2013) and also relaxed purifying selection on male-biased genes in aphids but not in psyllids (Brisson and Nuzhdin 2008; Purandare et al. 2014).
Although models predict interesting differences between the aphid genome and genomes of other X0 hemipterans, such as psyllids, robust tests of these predictions have been limited by the lack of chromosome-scale assemblies (Jaquiéry et al. 2013; Purandare et al. 2014; Pal and Vicoso 2015; Jaquiéry et al. 2018). In these previous studies, the assignment of genes to the X has been based on relative read depth in DNA samples from males versus females. New methods, including proximity ligation (Putnam et al. 2016) and long read sequencing, have enabled chromosome-level genome assemblies, enabling more accurate assignment of genes to chromosomal locations; three chromosome-level aphid genome assemblies are now available (Chen et al. 2019; Jiang et al. 2019; Li et al. 2019). For the present study, we built the first chromosome-level genome assembly of a psyllid species, the hackberry petiole gall psyllid (Pachypsylla venusta). Through comparisons with the three aphid genomes, we tested whether aphids and psyllids differ in 1) chromosomal locations of sex-biased genes, and 2) selective pressure on sex-biased genes and on genes on different chromosomes.
Results
Assembly and Annotation of the P. venusta Genome
We performed genome assembly of the P. venusta genome using 226 million Chicago read pairs and 180 million HiC read pairs based on the existing draft genome (Pven 2.0) (Sloan et al. 2014). The resulting new assembly has a total length of 482 Mb (N50 = 36.7 Mb) with similar genome size as the draft genome assembly (Pven 2.0 = 480 Mb, N50 = 0.1 Mb). Twelve scaffolds are >10 Mb, and are inferred to correspond to the 12 chromosomes suggested by previous studies of P. venusta karyotypes (Riemann 1966). The total length of the 12 chromosome-level scaffolds is 415 Mb (86.3% of the total assembly, supplementary table S1, Supplementary Material online). These 12 scaffolds range in size from 18.6 to 52.5 Mb (supplementary table S2, Supplementary Material online). These total assembly lengths are similar for P. venusta (482 Mb) and Acyrthosiphon pisum (540 Mb, Li et al. 2019) indicating similar genome sizes for these two species.
As psyllids have X0 sex determination, we determined which chromosome-level scaffolds correspond to the X chromosome by mapping resequencing data for males and females to the genome assembly. In males, the fifth longest scaffold (ScZCZ4B_2870, 38.9 Mb) has about half the sequencing depth of other chromosomes and half the normalized depth as compared with females (supplementary fig. S1, Supplementary Material online). Therefore, we designated scaffold ScZCZ4B_2870 as the X chromosome. We named the other 11 chromosome-level scaffolds from the longest to the shortest as chromosomes 1–11 (supplementary table S2, Supplementary Material online).
To evaluate the completeness of our assembly, we performed Benchmarking Universal Single-Copy Orthologs (BUSCOs) assessment (Simão et al. 2015) which queries the presence of 1,658 single-copy orthologous genes that are near-universal in Insecta. Our new P. venusta assembly showed a higher number (90.3%) of the complete BUSCOs than the previous P. venusta version 2.0 assembly (86.5%). The 12 chromosome-level scaffolds contain 86.8% of the complete BUSCOs (supplementary table S3, Supplementary Material online).
We annotated the chromosome-level assembly based on all available P. venusta RNA-seq data, using BRAKER2 (Stanke et al. 2006, 2008; Hoff et al. 2016). In total, we annotated 19,976 genes with 15,404 genes on the 11 assembled autosomes and 1,330 genes on the X chromosome. Similar to the pea aphid (A. pisum) and the corn leaf aphid (Rhopalosiphum maidis), the gene density (number of genes per million base pairs) is the lowest on the X chromosome among all chromosomes (supplementary table S2, Supplementary Material online). We assigned 7,071 genes to KEGG pathways using GhostKOALA (Kanehisa et al. 2016), and 13,551 genes to GO terms using PANNZER2 (Törönen et al. 2018).
Conserved X Chromosomes among Aphids and Differentiated X Chromosomes between Aphids and Psyllids
To compare the genomes of aphids and psyllids, we assigned paralogs within each genome using reciprocal best BLAST hits, and found that R. maidis and P. venusta have undergone fewer gene duplications than A. pisum (supplementary fig. S2, Supplementary Material online). Based on orthologous assignment, the three species share 5,954 orthologous groups, of which 5,310 are single-copy orthologs (supplementary fig. S3, Supplementary Material online). Acyrthosiphon pisum and R. maidis share 3,604 orthologous groups (including 3,193 single-copy orthologs) that are absent from P. venusta.
Strikingly, the set of single-copy orthologs on the X chromosome was highly conserved between A. pisum and R. maidis (supplementary fig. S4, Supplementary Material online), and the two X chromosomes show extensive synteny with one another but not with the autosomes (fig. 1A). In contrast, autosomes of A. pisum and R. maidis share some colinear gene blocks, but these are broken up across autosomes of each species. Thus, the gene set of the aphid X chromosome is stably separated from the gene set of autosomes, whereas autosomes do exchange blocks with one another. This finding indicates that the aphid X chromosome has undergone few rearrangements. To further confirm this finding, we searched syntenic blocks between A. pisum and the Indian Grain Aphid (Sitobion miscanthi) (Jiang et al. 2019) and again found that the X chromosomes of A. pisum and S. miscanthi shared more syntenic blocks than did autosomes (supplementary fig. S5, Supplementary Material online).
Fig. 1.

Genome synteny between (A) the two aphids, Acyrthosiphon pisum/Rhopalosiphum maidis, and (B) aphid and psyllid, A. pisum/Pachypsylla venusta. Bars represent chromosome-level scaffolds chromosomes. Length of the bars is proportional to the length of the chromosome assemblies. The bars of A. pisum are colored with blue: ChrA1, orange: ChrA2, green: ChrA3, red: ChrX. Syntenic blocks are colored based on the chromosomes of A. pisum.
Comparing between aphids and psyllids, P. venusta and A. pisum showed only five, relatively short, colinear gene blocks (fig. 1B). ChA1, ChrA2, ChrA3, ChrX of A. pisum shared the highest number of single-copy orthologs with Chr2, Chr1, Chr1, and Chr4 of P. venusta (supplementary fig. S4, Supplementary Material online).
Chromosomal Locations of Sex-Biased Genes
To locate sex-biased genes on chromosomes, we mapped RNA-seq data of different morphs to the chromosome-level assemblies of A. pisum and P. venusta. We compared the number of sex-biased genes to the total number of genes on each chromosome using χ2 tests. For A. pisum, we compared the gene expression of two males, two sexual females, and two asexual females. We found 2,357, 1,577, and 587 genes that were significantly up-regulated in males, sexual females, and asexual females with at least 2-fold change. Male-biased genes were significantly biased toward the X (32% on the X, P = 1.55e-07), whereas sexual female-biased genes and asexual female-biased genes were significantly underrepresented on the X (18% on the X, P = 2.88e-15 and 14% on the X, P = 1.40e-11, respectively) (table 1, supplementary table S2 and fig. S6, Supplementary Material online).
Table 1.
Chromosomal Locations of Genes from Different Categories in the Aphids Acyrthosiphon pisum, and Rhopalosiphum maidis, the Psyllid Pachypsylla venusta, and the Fly Drosophila melanogaster.
|
Acyrthosiphon pisum
|
Rhopalosiphum maidis
|
Pachypsylla venusta
|
Drosophila melanogaster
|
|||||||||||||||
|---|---|---|---|---|---|---|---|---|---|---|---|---|---|---|---|---|---|---|
| Autosomes | X Chromosome | Enriched Chromosomesa | P Value | Autosomes | X Chromosome | Enriched Chromosomesa | P Value | Autosomes | X Chromosome | Enriched Chromosomesa | P Value | Autosomes | X Chromosome | Y Chromosome | Enriched Chromosomesa | P Value | ||
| Total number of genes | 12,876 (73%) | 4,741 (27%) | — | — | 10,445 (81%) | 2,456 (19%) | — | — | 15,404 (92%) | 1,330 (8%) | — | — | 14,743 (85%) | 2,607 (15%) | 51 (0%) | — | — | |
| Sex-biased genesb | Male-biased | 1,601 (68%) | 756 (32%) | X | 1.55e-07 | — | — | — | — | 1,011 (94%) | 64 (6%) | A | 0.021 | — | — | — | — | — |
| Sexual female-biased | 1,297 (82%) | 280 (18%) | A | 2.88e-15 | — | — | — | — | 736 (91%) | 74 (9%) | — | 0.259 | — | — | — | — | — | |
| Asexual female-biased | 503 (86%) | 84 (14%) | A | 1.40e-11 | — | — | — | — | – | – | — | — | — | — | — | — | ||
| Unbiased | 6,774 (84%) | 1,248 (16%) | A | <2.20e-16 | — | — | — | — | 6,858 (92%) | 600 (8%) | — | 0.817 | — | — | — | — | — | |
| Unexpressed | 2,810 (53%) | 2,490 (47%) | X | <2.20e-16 | — | — | — | — | 6,799 (92%) | 592 (8%) | — | 0.890 | — | — | — | — | — | |
| Symbiosis-related genesb | Bacteriocyte-biased | 508 (88%) | 69 (12%) | A | 1.63e-15 | — | — | — | — | 1,676 (92%) | 139 (8%) | — | 0.684 | — | — | — | — | — |
| Body-biased | 1,702 (87%) | 252 (13%) | A | <2.20e-16 | — | — | — | — | 3,063 (92%) | 278 (8%) | — | 0.490 | — | — | — | — | — | |
| Unbiased | 7,561 (85%) | 1,385 (15%) | A | <2.20e-16 | — | — | — | — | 5,819 (94%) | 370 (6%) | A | 5.07e-07 | — | — | — | — | — | |
| Unexpressed | 3,214 (50%) | 3,152 (50%) | X | <2.20e-16 | — | — | — | — | 4,846 (90%) | 543 (10%) | X | 1.22e-06 | — | — | — | — | — | |
| Ribosomal protein genes | Mitochondrial ribosomal protein | 41 (93%) | 3 (7%) | A | 0.005 | 40 (95%) | 2(5%) | A | 0.031 | 37 (100%) | 0 (0%) | — | 0.138 | 63 (84%) | 12 (16%) | 0 (0%) | — | 0.902 |
| Cytoplasmic ribosomal protein | 98 (99%) | 1 (1%) | A | 1.27e-08 | 87 (94%) | 6 (6%) | A | 0.003 | 71 (100%) | 0 (0%) | A | 0.024 | 78 (84%) | 15 (16%) | 0 (0%) | — | 0.629 | |
| Mitochondrion-related genes | OXPHOS genes | 91 (88%) | 12 (12%) | A | 7.40e-04 | 83 (92%) | 7 (8%) | A | 0.010 | 76 (97%) | 2 (3%) | — | 0.122 | 78 (85%) | 14 (15%) | 0 (0%) | — | 1.000 |
| Genes related to mitochondrial GO term | 1,443 (74%) | 500 (26%) | — | 0.278 | 1,007 (86%) | 168 (14%) | A | 7.67E-05 | 1,667 (90%) | 182 (10%) | X | 0.005 | 1,149 (84%) | 219 (16%) | 0 (0%) | — | 0.348 | |
| Genes related to mitochondrial GO term (single-copy) | 1,080 (77%) | 315 (23%) | A | 4.78e-04 | 898 (88%) | 126 (12%) | A | 1.20E-07 | 1,013 (94%) | 61 (6%) | A | 0.009 | 529 (84%) | 102 (16%) | 0 (0%) | — | 0.466 | |
| Orthologs | Multi-copy orthologs | 4,273 (63%) | 2,527 (37%) | X | <2.2e-16 | 1,123 (61%) | 726 (32%) | X | <2.2E-16 | 4,706 (91%) | 447 (9%) | — | 0.101 | 4,185 (85%) | 724 (15%) | 20 (0%) | — | 0.413 |
| Single-copy orthologs | 8,996 (79%) | 2,428 (21%) | A | <2.2e-16 | 8,437 (83%) | 1,757 (17%) | A | 4.60E-04 | 12,176 (92%) | 995 (8%) | — | 0.215 | 7,154 (84%) | 1,406 (16%) | 3 (0%) | X | 3.62e-03 | |
Note.— The percentage of each gene category is in parentheses.
Enrichment of genes according to chromosomal location. Upper case indicates that genes are significantly (P < 0.05) enriched on autosomes (A), the X (X), or the Y (Y).
Male-biased genes are genes with P < 0.05 and ≥2-fold change in males; sexual female-biased are genes with P < 0.05 and ≥2-fold change in sexual females; asexual female-biased are genes with P < 0.05 and ≥2-fold change in asexual females; bacteriocyte-biased genes are genes with P < 0.05 and ≥2-fold change in bacteriocytes; body-biased genes are genes with P < 0.05 and ≥2-fold change in the rest of the body tissue; unbiased genes are genes with P < 0.05 and <2-fold change, or, P ≥ 0.05 and ≥5 reads on average in all the morphs; unexpressed are genes with P ≥ 0.05 and <5 reads on average in all the morphs.
As a large proportion of A. pisum genes (22–52%) was unbiased between morphs or had low levels of expression (fig. 2), we investigated whether those genes also showed strong trends in chromosomal location. We categorized genes as unbiased if they were significantly upregulated but with <2-fold change, or, did not show significant upregulation in any morphs and had on average ≥5 reads mapped across samples. If the genes lacked significant upregulation in a morph and had low expression (on average <5 reads across samples), we assigned them as “unexpressed genes.” In A. pisum, we found that unbiased genes were enriched on autosomes (16% on the X, P < 2.20e-16, table 1). Unexpressed genes were strongly enriched on the X (47% on the X, P < 2.20e-16), even more so than for male-biased genes.
Fig. 2.

Number and percentage of sex-biased genes on autosomes and X chromosomes of Acyrthosiphon pisum and Pachypsylla venusta. Bars represents the number of genes in each gene category on certain chromosomes (male-biased: yellow, sexual female-biased: blue, asexual female-biased: green, unbiased: light gray, and unexpressed: dark gray). The percentage denotes the proportion of each gene category on certain chromosomes.
For P. venusta, we compared gene expression for three males and three females. Male-biased genes were significantly enriched on autosomes (6% on the X, P = 0.021), but female-biased genes did not show this pattern (9% on the X, P = 0.259, table 1 and supplementary fig. S6, Supplementary Material online). The enrichment of male-biased genes on autosomes in P. venusta thus resembles that reported for other hemipterans (Pal and Vicoso 2015) and is the opposite of the pattern found in A. pisum. The unbiased and unexpressed genes did not show significant trends for chromosomal location in P. venusta (fig. 2 and table 1).
Selective Pressure on Genes
To investigate the selective pressure on genes with different expression levels in males and females, we estimated dN/dS for single-copy orthologous genes for a pair of related aphid species (A. pisum/R. maidis) and a pair of related psyllid species (P. venusta/Pachypsylla celtidismamma). For aphids, unexpressed genes showed the highest dN/dS (fig. 3), suggesting that these genes are under relaxed purifying selection. Comparing genes with differential expression across morphs, results differed for aphids versus psyllids. For A. pisum, male-biased genes showed the highest dN/dS whereas asexual female-biased genes showed the lowest dN/dS (fig. 3). Likewise, genes on the X chromosome of A. pisum showed significantly higher dN/dS than genes on the autosomes (P < 2.2e-16, Kruskal–Wallis rank sum test). For P. venusta, dN/dS was not significantly different between genes with male-biased expression and genes with female-biased expression. Genes on the X showed significantly lower dN/dS than genes on autosomes (P = 0.04, Kruskal–Wallis rank sum test), a pattern opposite to that seen in aphids.
Fig. 3.

Distribution of dN/dS ratios for each gene category. The inset on the right corner of each panel is the summary of overall dN/dS distribution for different gene categories. For sex-biased genes, letters on top of the violin plots denote significant differences. Letters were ordered alphabetically based on the median of the distributions from the highest to the lowest. As there were only two unexpressed genes for Pachypsylla venusta, the proportion of expressed genes were 0.5 for each gene.
Jaquiéry et al. (2018) suggested that the elevated dN/dS of genes on the A. pisum X chromosome is the result of weak selection, associated with low average expression levels. Genes with low levels of expression are often less important to phenotypes and under relaxed purifying selection (Duret and Mouchiroud 2000; Nabholz et al. 2013; Jaquiéry et al. 2018). We investigated the overall gene expression on autosomes and the X chromosome of A. pisum and P. venusta. We found that in all the A. pisum morphs, autosomal genes show higher expression than genes on the X (fig. 4) (P < 2.2e-16, Kruskal–Wallis rank sum test). In P. venusta, gene expression did not differ significantly between autosomes and the X chromosome.
Fig. 4.
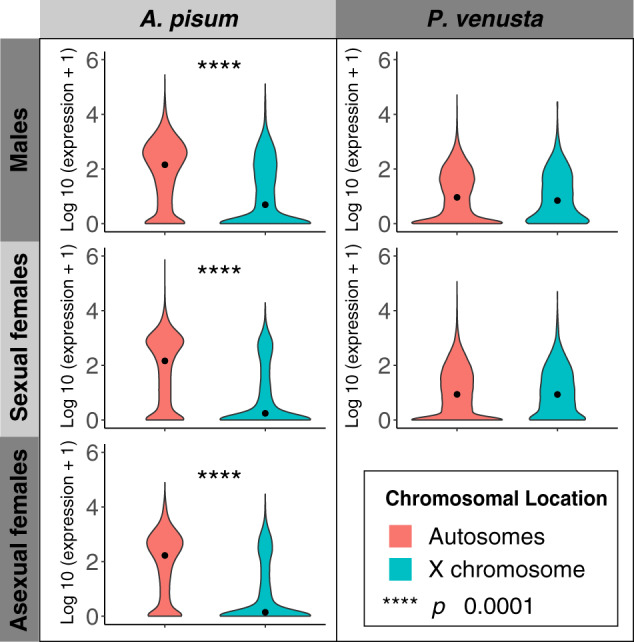
Gene expression of autosomal and X-linked genes in different morphs. The levels of gene expression are log10 transformed. Dots display the median gene expression. The distribution of expression is colored based on the chromosomal locations of genes (autosomal: red, X-linked: blue).
Another factor potentially affecting expression in males and females is dosage compensation, which has been reported in other hemipteran species (Pal and Vicoso 2015). Richard et al. (2017) found evidence that the dosage compensation in aphids occurs through enhanced chromatin accessibility of the X in males. We estimated the male to female ratio of expression for autosomal and X-linked genes. If dosage compensation is missing, the ratio between male and female expression of X-linked genes should be ∼0.5 (Pal and Vicoso 2015). We found that the males/sexual females and males/asexual females ratio for A. pisum is 1.02 and 0.96 for autosomal genes, and 1.31 and 1.14 for X-linked genes (supplementary fig. S7, Supplementary Material online), suggesting complete dosage compensation in aphids (Pal and Vicoso 2015). However, the ratio of autosomal and X-linked gene expression between male and female P. venusta is 0.96 and 0.81, respectively, indicating higher expression of X-linked genes in females and implying incomplete dosage compensation.
Chromosomal Locations of Important Functional Genes
As genes on the A. pisum X show low levels of expression, we were interested in whether functionally important genes as a whole avoid the aphid X chromosome. We identified several gene categories expected to be critical for fitness. One such set consists of genes supporting the obligate bacterial endosymbionts that live within specialized cells (bacteriocytes) and that are required for growth and reproduction in both aphids (Hansen and Moran 2011; Smith and Moran 2020) and psyllids (Sloan et al. 2014). In addition to these symbiosis-related genes, we investigated the chromosomal locations of ribosomal protein genes, mitochondrion-related genes, and all single-copy and multicopy orthologs.
To identify genes underlying symbiosis, we compared gene expression profiles of bacteriocytes and the remainder of the body using previously published RNA-seq data from A. pisum (Hansen and Moran 2011) and P. venusta (Sloan et al. 2014). We identified 577 and 1,815 bacteriocyte-biased genes that were significantly upregulated in bacteriocytes with at least 2-fold change compared with other body tissues. For A. pisum, all the bacteriocyte-biased, body-biased, and unbiased genes were significantly enriched on autosomes (table 1). The unexpressed genes were highly enriched on the X, as found in the sex-biased gene expression experiment. For P. venusta, bacteriocyte-biased and body-biased genes showed no enrichment on X versus autosomes. Unbiased genes were enriched on autosomes. Unexpressed genes were slightly but significantly enriched on the X.
Genes encoding ribosomal proteins are among the most important and conserved sets of genes and can be divided into genes encoding components of the mitochondrial ribosome and genes encoding components of the cytoplasmic ribosome. We located 44, 42, and 37 mitochondrial ribosomal protein genes and 99, 93, and 71 cytoplasmic ribosomal protein genes in A. pisum, R. maidis, and P. venusta, respectively (table 1 and supplementary table S2, Supplementary Material online). All ribosomal protein gene sets were enriched on autosomes in each species, though this enrichment was not significant for P. venusta mitochondrial ribosomal protein genes, which were few in number. For the four and eight ribosomal protein genes of A. pisum and R. maidis on the X, three and seven of them had paralogs on autosomes (supplementary table S4, Supplementary Material online). This finding supports the hypothesis that the X is a less preferred location for ribosomal proteins. For comparison, we also included the chromosomal locations of genes from Drosophila melanogaster in our analysis. The mitochondrial and cytoplasmic ribosomal proteins of D. melanogaster showed no significant enrichment on autosomes or on the X.
Another important functional group includes genes in the oxidative phosphorylation (OXPHOS) pathway, which is involved in ATP synthesis, a critical cellular function. We identified 107, 90, 87, and 92 OXPHOS genes in A. pisum, R. maidis, P. venusta, and D. melanogaster, respectively (table 1 and supplementary table S2, Supplementary Material online). Based on χ2 tests, OXPHOS genes were significantly enriched on autosomes for both aphids (A. pisum and R. maidis), but not for P. venusta and D. melanogaster. Similar to the aphid ribosomal protein genes, most of the OXPHOS genes on the aphid X had paralogs (supplementary table S5, Supplementary Material online).
We also examined chromosomal locations of additional genes related to mitochondrial function based on the gene ontology (GO) annotation. Mitochondrial GO term-related genes of A. pisum and R. maidis showed enrichment on autosomes, whereas the genes of P. venusta were enriched on the X. Single-copy mitochondrial GO term related genes were biased toward autosomes for all three species. For D. melanogaster, no significant trend in chromosomal location was found for any mitochondrion-related gene category.
Single-copy orthologs are more likely to be under stringent selection than multi-copy genes, for which redundancy can reduce selection intensity. Thus, if genes essential to fitness are enriched on autosomes in aphids but not in psyllids, we would expect single-copy genes to be enriched on autosomes in aphids and multi-copy genes to be enriched on the X chromosome; neither pattern of enrichment is predicted for psyllids. As predicted, for A. pisum and R. maidis, single-copy orthologs were significantly enriched on autosomes, and duplicated orthologs were significantly enriched on the X, whereas for P. venusta, no significant enrichment was found (table 1). For D. melanogaster, single-copy orthologs were slightly enriched on the X, and 40% of Y-linked genes were identified as multi-copy orthologs although not significant.
Discussion
In typical sexual species, the distribution of sexually antagonistic mutations on the X versus on autosomes is affected by two opposing factors (Kaiser and Bachtrog 2010). First, as the X is passed on 2/3 of the time by females, the X is expected to accumulate female-beneficial mutations. But, as males only have one X, selection on the X is more efficient in males potentially resulting in the accumulation of male-beneficial mutations, provided selective pressure is sufficient in males. In the unusual case of aphids, the first factor is eliminated, as the X is transmitted equally by males and females (Jaquiéry et al. 2013). Thus, efficient selection on the male X could lead to enrichment of male-biased genes on the X chromosome. In addition, aphids are unusual in the dominance of asexuality in their life cycles. As a result, selective pressure on asexual females exceeds that on males. Jaquiéry et al. (2013) modeled the effects of sexually antagonistic mutations on aphid autosomes and X chromosome, and predicted beneficial mutations for asexual females to be enriched on autosomes and beneficial mutations for males to be enriched on the X. Other evidence, from dN/dS ratios, has suggested that selection on male-biased genes is relatively weak compared with that on asexual female-based genes (Brisson and Nuzhdin 2008; Purandare et al. 2014; Jaquiéry et al. 2018). However, previous tests of these predictions were limited by error-prone methods for identifying gene location, limited gene numbers and lack of a related comparison lineage with a similar sex determination system. We have extended previous studies by comparing gene distributions on chromosomes and evolutionary patterns for aphids and psyllid, which share a similar X0 sex determination system but differ in the occurrence of an extended phase of asexuality in the life cycle. Our results give strong support to the predictions from Jaquiéry et al. (2013, 2018) and suggest that an asexual life cycle phase can have a strong impact on genomic evolution.
Highly Differentiated X Chromosomes between A. pisum and P. venusta
We find striking differences between aphids and psyllids in patterns of evolution on the X chromosome versus autosomes, as well as in the levels of overall synteny, locations of important functional genes and levels of purifying selection on genes in different locations. We confirmed that male-biased genes are enriched on the X chromosome of A. pisum (fig. 2 and table 1). In contrast, male-biased genes of psyllids are enriched on autosomes, as has been found for other X0 hemipterans (Pal and Vicoso 2015). Our findings strongly support the prediction of Jaquiéry et al. (2013) that male-biased genes are more likely to invade the X for aphids. For psyllids, the X is passed on by females more often than by males, and, as predicted, male-beneficial genes are enriched on autosomes. The missing inactivation of the X in spermatocytes of hemipterans could also contribute to the enrichment of female-biased genes on the X (Messthaler and Traut 1975; Pal and Vicoso 2015).
Strong Purifying Selection Favors Location on Autosomes in Aphids but Not in Psyllids
Selection in females, which dominate in the aphid life cycle, is expected to be less efficient for genes on the X, resulting in the location of genes important for fitness on the autosomes (Jaquiéry et al. 2018). Indeed, we found that A. pisum X-linked genes had lower expression and higher dN/dS compared with genes on autosomes, indicating that the aphid X has accumulated genes under relaxed selection. In contrast, P. venusta did not show significantly different expression or dN/dS between genes on autosomes and on the X (figs. 3 and 4).
Low levels of expression suggest that genes are likely to be less important to phenotypes and therefore under relaxed purifying selection (Duret and Mouchiroud 2000; Nabholz et al. 2013; Jaquiéry et al. 2018). In support of this idea, genes categorized as unexpressed showed the highest dN/dS in both aphids and psyllids (fig. 3). In aphids, genes related to males, which are the rare morph, also showed low gene expression and elevated dN/dS (fig. 3), as reported in previous studies on fewer genes (Brisson and Nuzhdin 2008; Purandare et al. 2014). These male-biased aphid genes occur preferentially on the X chromosome (fig. 2), and aphid genes on the X have higher dN/dS compared with those on autosomes. In contrast, in the psyllid, P. venusta, X-linked genes showed a significantly lower dN/dS compared with autosomal genes. As male psyllids are common morphs and have only one copy of the X, purifying selection on recessive deleterious mutations is expected to be more efficient on the X than on autosomes, leading to the removal of deleterious nonsynonymous changes.
Additional forces have been proposed to affect chromosomal locations of genes that interact with maternally inherited elements, such as mitochondria (Drown et al. 2012) or heritable symbionts (Becking et al. 2019). These elements will themselves evolve to favor female fitness but not male fitness (i.e., “mother’s curse”), since males are evolutionary dead ends (Gemmell et al. 2004). Since these elements are more often transmitted with the X chromosome than with autosomes, selection to maintain coadapted combinations favors enrichment of interacting genes on the X chromosome (Drown et al. 2012). However, selection based on sexually antagonistic mutations gives opposite results: Sexual conflict theory predicts that mitochondrion-related genes will be enriched on autosomes to avoid male-deleterious/female-beneficial mutations on the X chromosome (Ågren et al. 2019). Nonrandom chromosomal distributions of mitochondrion-related genes are observed in different groups of animals, but the patterns are not consistent across species (Drown et al. 2012; Dean et al. 2014). In aphids, male-beneficial genes are enriched on the X; however, mitochondrion-related genes prefer to stay on autosomes, a pattern that does not fit predictions of the sexual conflict theory. The dominant pattern revealed by our analyses is that autosomes are enriched for enriched for all important gene categories, such as those underlying translation in the cytoplasm and also including include mitochondrion- and symbiosis-related genes. Therefore, the chromosomal distribution of mitochondrion- and symbiosis-related genes in aphids fits with the striking tendency of important functional genes to avoid the X.
All of these observations implicate the aphid X chromosome as a less preferred location for highly expressed genes and especially highly expressed genes that are important in asexual females. Indeed, genes in all of the conserved functional categories, including symbiosis-related genes, ribosomal protein genes, mitochondrion-related genes, and single-copy orthologs, were depleted on the X in aphids, but not in psyllids. Thus, in aphids specifically, the X appears to be a dangerous place for genes of functional importance, especially those important in the dominant, asexual life cycle phase. It appears that the X chromosome of aphids is decaying with low gene expression and ongoing accumulation of deleterious mutations.
Highly Conserved X Chromosome Gene Sets within Aphids
An unexpected finding is the striking conservation of the gene content and order on the aphid X chromosome as compared with autosomes. X chromosomes of all three aphid species had very similar sets of genes, with large areas of conserved order, and no exchange of genes with autosomes (figs. 1A, supplementary figs. S4 and S5, Supplementary Material online). In contrast, aphid autosomes showed many rearrangements and exchanges of segments. Aphids have holocentric chromosomes, which are known to facilitate chromosomal fusion and fission (Mandrioli and Carlo Manicardi 2012), so the autosomal rearrangements are not surprising. Possible forces leading to conservation of the aphid X chromosome include the presence of the nucleolar organizing regions and associated ribosomal RNA arrays on the X chromosome, and their likely roles in the unusual reproductive processes of aphids. Males are produced by asexual females in a specialized process in which autosomes divide mitotically whereas the paired X chromosomes remain together and then undergo a “mini-meiosis” (Blackman and Hales 1986; Blackman and Spence 1996). Male aphids then undergo a unique spermatogenesis process. As all sperms have an X, two copies of the autosomes compete for the single the X, and the “losing” autosomal set is eliminated (Melters et al. 2012; Manicardi et al. 2015). Fusion between autosomes and all or part of the X could interfere with the production of males, or could lead to an inviable spermatocyte (Hales 1989). Selection against such fusion or translocations could underlie the observed lack of gene exchange between autosomes and the X. In aphid lineages that permanently lose the sexual phase, and thus no longer have males or spermatogenesis, the X is observed to undergo fusions or other exchanges with autosomes (Blackman 1980; Sunnucks et al. 1998), consistent with the hypothesis that unusual requirements for male production and/or spermatogenesis act to conserve content of the aphid X chromosome. A prediction is that other hemipteran genomes with X0 sex determination would not show the same conservation of gene content on the X. Pal and Vicoso (2015) found evidence for relative conservation of X chromosome gene content across several hemipteran species, but the conservation we observe in aphids appears more extreme. In the future, more chromosome-level assemblies of hemipteran species could help further disentangle the relationship between the evolution of the X chromosome in different sex determination systems.
Materials and Methods
Pachypsylla venusta Sample Preparation
We collected psyllid individuals from petiole galls on multiple Celtis reticulata trees in Austin, TX (30.350335, –97.754521). For sequencing aimed at a chromosome-level genome assembly, we pooled 3.3 g of male and female nymphs, froze and shipped to Dovetail Genomics (Santa Cruz, CA, USA) for DNA extraction, proximity ligation methods (Chicago and HiC library preparation) (Putnam et al. 2016), and 150-bp paired-end sequencing on Illumina HiSeq X platform.
To obtain male and female adults for resequencing and RNA-seq, we opened the galls and allowed the recovered psyllid nymphs to continue development in Petri dishes. Nymphs molted into adults in one to two weeks. We identified the sex of adults based on the presence or absence of an ovipositor. We collected adults and nymphs (supplementary table S6, Supplementary Material online), flash froze the individuals and stored at –80 °C. For DNA extraction, we ground frozen tissues from each individual in liquid nitrogen. We then extracted the genomic DNA using Qiagen DNeasy Blood & Tissue Kits following the manufacturer’s protocol. We estimated the DNA concentration using Qubit DNA BR Assay Kit (ThermoFisher Scientific) and used 250 µg of DNA to construct sequencing libraries using Swift 2S Turbo Flexible DNA Library Kit (Swift Biosciences) and Illumina TruSeq DNA Single Index Set A.
For RNA extraction, we combined two adult individuals together (supplementary tables S6 and S7, Supplementary Material online) to get enough RNA. We extracted the total RNA using TRIzol Reagent (Invitrogen) following the manufacturer’s protocol and resuspended extracted RNA in 50 µl RNase-free water. To avoid any possibility of genomic DNA contamination, we digested the total RNA using DNase from the Ambion TURBO DNA-free Kit (ThermoFisher Scientific). We estimated the RNA concentration using Qubit RNA BR Assay Kit (ThermoFisher Scientific). We then used NEBNext rRNA Depletion Kit (New England Biolabs) on 1 µg of total RNA per sample to remove eukaryotic ribosomal RNA. We constructed RNA libraries using Ultra II Directional RNA Library Kit (New England Biolabs) and NEBNext Sample Purification Beads (New England Biolabs). We sent prepared libraries to Novogene for two lanes of HiSeq X Ten sequencing.
Pachypsylla venusta Genome Assembly and Annotation
We first assembled the psyllid genome using Chicago data based on the draft psyllid genome assembly (Pven_2.0 with National Center for Biotechnology Information [NCBI] accession number: GCA_000695645.2) using the HiRise assembler version v2.1.6-072ca03871cc (Putnam et al. 2016) using default parameters. The HiRise assembler breaks the original assembly when it conflicts with proximity ligation results. We then used the result from Chicago assembly as a basis for a further assembly using the HiC data.
To evaluate the completeness of the assembly, we performed BUSCOs assessment the chromosome-level assembly and the draft genome using BUSCO version 3.0.2 (Simão et al. 2015) with 1,658 single-copy Insecta orthologous gene set from OrthoDB version 9 (Zdobnov et al. 2017).
To annotate the gene structure of the chromosome-level assembly, we used the newly obtained RNA-seq data and all the available RNA-seq data from P. venusta on NCBI (under BioProjects: PRJNA275248 and PRJNA217831). We first filtered RNA-seq reads using Trimmomatic version 0.38 (Bolger et al. 2014) to trim Illumina adaptors and remove low quality base pairs. Details about the workflow can be found on GitHub (https://github.com/lyy005/Psyllid_chromosome_assembly, last accessed March 20, 2020). We then mapped the reads to the chromosome-level assembly using HISAT2 version 2.1.0 (Kim et al. 2015). For better alignment, we set –rna-strandness set to RF to allow strain-specific alignment and we applied –downstream-transcriptome-assembly to avoid alignments with short anchors. We then annotated the gene structure using BRAKER2 (Stanke et al. 2006, 2008; Hoff et al. 2016) with soft masking (–softmasking) based on mapped RNA-seq data. We also calculated gene density per million base pairs on each chromosome using the number of genes divided by the length of the chromosome, multiplied by 1,000,000.
To annotate the function of the genes, we submitted predicted amino acid sequences to GhostKOALA server (last accessed on May 15, 2019) (Kanehisa et al. 2016) and PANNZER2 server (last accessed May 15, 2019) (Törönen et al. 2018) for related pathway information and GO information. Based on KEGG annotation, we assigned genes as OXPHOS genes if the genes were annotated in the KEGG pathway map00190 (OXPHOS). For mitochondrial function related GO terms, we picked any genes with any of the GO terms relating to mitochondrial function, including: GO:0005739 (mitochondrion), GO:0005759 (mitochondrial matrix), GO:0005761 (mitochondrial ribosome), GO:0005743 (mitochondrial inner membrane), GO:0005744 (TIM23 mitochondrial import inner membrane translocase complex), GO:0030150 (protein import into mitochondrial matrix), GO:0031966 (mitochondrial membrane), GO:0005741 (mitochondrial outer membrane), GO:0000276 (mitochondrial proton-transporting ATP synthase complex, coupling factor F[o]).
X Chromosome Assignment
To identify the X chromosome, we mapped the whole genome resequencing data from male and female individuals to the chromosome-level assembly. As P. venusta has X0 sex determination, we expected the male to female median sequencing depth to be approximately double for autosomes compared with the X chromosome. First, we performed Trimmomatic version 0.38 on resequencing data in the same way as described above to remove low quality reads. Then, we mapped clean reads to the chromosome-level assembly using Bowtie2 version 2.3.4.3 (Langmead and Salzberg 2012) with default parameters. We converted the resulting SAM files to BAM files, sorted and indexed using SAMtools version 1.9 (Li et al. 2009). We estimated the sequencing depth based on 10-kb sliding windows with 2-kb steps. The sliding windows were generated using “makewindows” command in BEDTools version 2.27.1 (Quinlan and Hall 2010). We then estimated the sequencing depth of each window using mosdepth version 0.2.3 (Pedersen and Quinlan 2018). We normalized the overall sequencing depths among male individuals and female individuals separately and calculated the male to female sequencing depth for each window. Male and female individuals were normalized separately based on the sequencing depth of the individuals with the lowest sequencing depth. Sequencing depth of each male individual was multiplied by the ratio of median sequencing depth between the individual and individual Male 2 (supplementary table S7, Supplementary Material online). Sequencing depth of each female individual was multiplied by the ratio of median sequencing depth between the individual and individual Female 3 (supplementary table S7, Supplementary Material online). We plotted the sequencing depth distribution using violin plot in ggplot2 version 3.2.1 (R Core Team 2016; Wickham 2016).
Comparative Analysis of P. venusta, A. pisum, and R. maidis Genomes
We downloaded the chromosome-level assemblies and annotations of A. pisum (Li et al. 2019) and R. maidis (Chen et al. 2019) from NCBI. We picked the longest coding sequence of each gene and translated the nucleotide sequences to amino acid sequences. We assigned genes to orthologous groups using OrthoVenn2 server (Wang et al. 2015; Xu et al. 2019), which is an online ortholog assignment tool based on OrthoMCL (Li et al. 2003). Default parameters were used for OrthoVenn2 with e-value = 1e-2 and inflation value = 1.5. We used the 1:1 single-copy orthologs in all three species for genome synteny analysis using MCScanX_h (Wang et al. 2012) and visualized with SynVisio (https://synvisio.github.io/, last accessed March 20, 2020).
Identifying Sex-Biased Genes Using RNA-Seq Data
To identify sex-biased genes, we compared the gene expression among different morphs of A. pisum and P. venusta. We downloaded the RNA-seq data generated from a previous study (Jaquiéry et al. 2013) and compared the gene expression of two male, two sexual female and two asexual female individuals using DESeq2 (Love et al. 2014). We compared the gene expression of three males and three females of P. venusta. We removed low quality reads using Trimmomatic version 0.38 (Bolger et al. 2014) and aligned the reads to chromosome-level assemblies using HISAT2 version 2.1.0 (Kim et al. 2015) as mentioned above. We then used “htseq-count” command in the HTSeq version 0.6.1p1 (Anders et al. 2015) to estimate the number of reads mapped to the exons of each gene (“–type exon”). Counts of the genes were normalized and calculated differentially expressed genes using DESeq2 version 1.20.0 (Love et al. 2014) in R (R Core Team 2016). To take sequencing depth and RNA composition into account, median of ratios method implemented in DESeq2 was used for normalization. As there are three conditions for aphids (sexual males, sexual females, and asexual females), three differential expression analyses were performed by treating one sex as one condition and the other two sexes as the other condition. Wald significance tests were used for identifying differentially expressed genes. Genes that were significantly upregulated in certain morphs with at least 2-fold change were classified as significantly biased genes for that morph. Genes that were significantly upregulated but with <2-fold-change, or, did not show significant upregulation in any morphs and had on average ≥5 reads mapped across samples were identified as unbiased genes. Lastly, genes that did not significantly upregulate and had fewer than five reads on average were identified as unexpressed genes. Scripts used to classify genes into different categories are available on GitHub: https://github.com/lyy005/Psyllid_chromosome_assembly (last accessed March 20, 2020).
Identifying Symbiosis-Related Genes Using RNA-Seq Data
To identify symbiosis-related genes, we compared insect gene expression between body and bacteriocyte using RNA-seq data from NCBI BioProjects PRJNA217831 for P. venusta (Sloan et al. 2014) and PRJNA79741 for A. pisum (Hansen and Moran 2011). For P. venusta, the same parameters were used for data filtering, mapping and DESeq2 analysis as described above. As the RNA-seq data of Hansen and Moran (2011) has no replicates, NOISeq version 2.30.0 (Tarazona et al. 2011, 2015) was used to simulate technical replicates for differential expression analysis. Reads were first normalized using Trimmed Mean of M values (tmm) approach in NOISeq. To simulate technical replicates, 20% of the reads were used (pnr = 0.2) to simulate five replicates (nss = 5) for body and bacteriocyte with 2% variability (v = 0.02).
Estimating dN/dS for A. pisum and P. venusta Genes
To understand the evolution of genes, we estimated dN/dS for A. pisum and P. venusta genes by comparing to closely related species. Besides P. venusta, the Asian citrus psyllid (Diaphorina citri) is the closest species to P. venusta with a reference genome assembly (Saha et al. 2017). However, the estimation of dS value between P. venusta and D. citri genes was not reliable due to excessive divergence and saturation of changes. Therefore, we used transcriptome data for a closely related species, the hackberry nipplegall psyllid (P. celtidismamma) (Johnson et al. 2018). As transcriptome data may assemble different isoforms of the same gene into separate genes, we assigned the orthologs based on the P. venusta genes, D. citri genes and the assembled transcriptome of P. celtidismamma. Pachypsylla celtidismamma genes in the orthologous groups that were found to be single-copy between P. venusta and D. citri were used for downstream analysis. If multiple genes of P. celtidismamma were found in the orthologous group, the longest genes were used to estimate dN/dS.
We performed codon-based alignment on the single-copy orthologs of A. pisum/R. maidis and P. venusta/P. celtidismamma. The codon-based alignment program is a Perl pipeline based on mafft-linsi function in MAFFT version 7.407 (Katoh and Standley 2013) and is available on GitHub (https://github.com/lyy005/codon_alignment/, last accessed January 30, 2020) (Li et al. 2017). We removed poorly aligned regions using Gblocks version 0.91b (Castresana 2000). We then calculated dN/dS using KaKs Calculator version 2.0 (Zhang et al. 2006) with the “Model Averaging” method.
Statistical Analysis
For statistical analysis, we used Kruskal–Wallis rank sum test (kruskal.test in R version 3.6.0) to test for gene expression difference and dN/dS difference between groups of genes (R Core Team 2016). For post hoc test for multiple comparisons of groups, we used kruskalmc in R package “pgirmess” version 1.6.9 (Giraudoux 2018). To test the distribution of genes on chromosomes, we used χ2 test (chisq.test) in R package “stats” version 3.6.0 (R Core Team 2016).
Data Availability
Pachypsylla venusta genome assembly and sequencing data are available on NCBI under the BioProject ID PRJNA603545. The bioinformatic scripts used in this study are available on GitHub (https://github.com/lyy005/Psyllid_chromosome_assembly, last accessed March 19, 2020).
Supplementary Material
Acknowledgments
This study was supported by the National Science Foundation (Grant No. DEB 1551092 to N.A.M.); B.Z. was supported by the China Scholarship Council and the Science and Technology Innovation Program of the Chinese Academy of Agricultural Sciences. We thank David L. Stern from Janelia Research Campus of the Howard Hughes Medical Institute for his help with genome annotation.
References
- Ågren JA, Munasinghe M, Clark AG.. 2019. Sexual conflict through mother’s curse and father’s curse. Theor Popul Biol. 129:9–17. [DOI] [PMC free article] [PubMed] [Google Scholar]
- Anders S, Pyl PT, Huber W.. 2015. HTSeq—a Python framework to work with high-throughput sequencing data. Bioinformatics 31(2):166–169. [DOI] [PMC free article] [PubMed] [Google Scholar]
- Bachtrog D. 2008. Evidence for male-driven evolution in Drosophila. Mol Biol Evol. 25(4):617–619. [DOI] [PubMed] [Google Scholar]
- Bachtrog D, Kirkpatrick M, Mank JE, McDaniel SF, Pires JC, Rice W, Valenzuela N.. 2011. Are all sex chromosomes created equal? Trends Genet. 27(9):350–357. [DOI] [PubMed] [Google Scholar]
- Becking T, Chebbi MA, Giraud I, Moumen B, Laverré T, Caubet Y, Peccoud J, Gilbert C, Cordaux R.. 2019. Sex chromosomes control vertical transmission of feminizing Wolbachia symbionts in an isopod. PLoS Biol. 17(10):e3000438. [DOI] [PMC free article] [PubMed] [Google Scholar]
- Bizzaro D, Mandrioli M, Zanotti M, Giusti M, Manicardi GC.. 2000. Chromosome analysis and molecular characterization of highly repeated DNAs in the aphid Acyrthosiphon pisum (Aphididae, Hemiptera). Genetica 108(2):197–202. [DOI] [PubMed] [Google Scholar]
- Blackman RL. 1980. Chromosome numbers in the Aphididae and their taxonomic significance. Syst Entomol. 5(1):7–25. [Google Scholar]
- Blackman RL, Hales DF.. 1986. Behaviour of the X chromosomes during growth and maturation of parthenogenetic eggs of Amphorophora tuberculata (Homoptera, Aphididae), in relation to sex determination. Chromosoma 94(1):59–64. [Google Scholar]
- Blackman RL, Spence JM.. 1996. Ribosomal DNA is frequently concentrated on only one X chromosome in permanently apomictic aphids, but this does not inhibit male determination. Chromosome Res. 4(4):314–320. [DOI] [PubMed] [Google Scholar]
- Bolger AM, Lohse M, Usadel B.. 2014. Trimmomatic: a flexible trimmer for Illumina sequence data. Bioinformatics 30(15):2114–2120. [DOI] [PMC free article] [PubMed] [Google Scholar]
- Brisson JA, Nuzhdin SV.. 2008. Rarity of males in pea aphids results in mutational decay. Science 319(5859):58–58. [DOI] [PubMed] [Google Scholar]
- Castresana J. 2000. Selection of conserved blocks from multiple alignments for their use in phylogenetic analysis. Mol Biol Evol. 17(4):540–552. [DOI] [PubMed] [Google Scholar]
- Chen W, Shakir S, Bigham M, Richter A, Fei Z, Jander G.. 2019. Genome sequence of the corn leaf aphid (Rhopalosiphum maidis Fitch). Gigascience 8(4):giz033. [DOI] [PMC free article] [PubMed] [Google Scholar]
- Dean R, Mank JE.. 2014. The role of sex chromosomes in sexual dimorphism: discordance between molecular and phenotypic data. J Evol Biol. 27(7):1443–1453. [DOI] [PubMed] [Google Scholar]
- Dean R, Zimmer F, Mank JE.. 2014. The potential role of sexual conflict and sexual selection in shaping the genomic distribution of mito-nuclear genes. Genome Biol Evol. 6(5):1096–1104. [DOI] [PMC free article] [PubMed] [Google Scholar]
- Drown DM, Preuss KM, Wade MJ.. 2012. Evidence of a paucity of genes that interact with the mitochondrion on the X in mammals. Genome Biol Evol. 4(8):875–880. [DOI] [PMC free article] [PubMed] [Google Scholar]
- Duret L, Mouchiroud D.. 2000. Determinants of substitution rates in mammalian genes: expression pattern affects selection intensity but not mutation rate. Mol Biol Evol. 17(1):68–74. [DOI] [PubMed] [Google Scholar]
- Gallach M, Betrán E.. 2011. Intralocus sexual conflict resolved through gene duplication. Trends Ecol Evol. 26(5):222–228. [DOI] [PMC free article] [PubMed] [Google Scholar]
- Gemmell NJ, Metcalf VJ, Allendorf FW.. 2004. Mother’s curse: the effect of mtDNA on individual fitness and population viability. Trends Ecol Evol. 19(5):238–244. [DOI] [PubMed] [Google Scholar]
- Giraudoux P. 2018. pgirmess: spatial analysis and data mining for field ecologists. R Package version 1.9. Available from: https://CRAN.R-project.org/package=pgirmess.
- Gurbich TA, Bachtrog D.. 2008. Gene content evolution on the X chromosome. Curr Opin Genet Dev. 18(6):493–498. [DOI] [PMC free article] [PubMed] [Google Scholar]
- Hales DF. 1989. The chromosomes of Schoutedenia lutea (Homoptera, Aphidoidea, Greenideinae), with an account of meiosis in the male. Chromosoma 98(4):295–300. [DOI] [PubMed] [Google Scholar]
- Hansen AK, Moran NA.. 2011. Aphid genome expression reveals host–symbiont cooperation in the production of amino acids. Proc Natl Acad Sci USA. 108(7):2849–2854. [DOI] [PMC free article] [PubMed] [Google Scholar]
- Hoff KJ, Lange S, Lomsadze A, Borodovsky M, Stanke M.. 2016. BRAKER1: unsupervised RNA-Seq-based genome annotation with GeneMark-ET and AUGUSTUS. Bioinformatics 32(5):767–769. [DOI] [PMC free article] [PubMed] [Google Scholar]
- Jaquiéry J, Peccoud J, Ouisse T, Legeai F, Prunier-Leterme N, Gouin A, Nouhaud P, Brisson JA, Bickel R, Purandare S, et al. 2018. Disentangling the causes for faster-X evolution in aphids. Genome Biol Evol. 10(2):507–520. [DOI] [PMC free article] [PubMed] [Google Scholar]
- Jaquiéry J, Rispe C, Roze D, Legeai F, Trionnaire GL, Stoeckel S, Mieuzet L, Silva CD, Poulain J, Prunier-Leterme N, et al. 2013. Masculinization of the X chromosome in the pea aphid. PLoS Genet. 9(8):e1003690. [DOI] [PMC free article] [PubMed] [Google Scholar]
- Jaquiéry J, Stoeckel S, Rispe C, Mieuzet L, Legeai F, Simon J-C.. 2012. Accelerated evolution of sex chromosomes in aphids, an X0 system. Mol Biol Evol. 29(2):837–847. [DOI] [PubMed] [Google Scholar]
- Jiang X, Zhang Q, Qin Y, Yin H, Zhang S, Li Q, Zhang Y, Fan J, Chen J.. 2019. A chromosome-level draft genome of the grain aphid Sitobion miscanthi. Gigascience 8(8):giz101. [DOI] [PMC free article] [PubMed] [Google Scholar]
- Johnson KP, Dietrich CH, Friedrich F, Beutel RG, Wipfler B, Peters RS, Allen JM, Petersen M, Donath A, Walden KKO, et al. 2018. Phylogenomics and the evolution of hemipteroid insects. Proc Natl Acad Sci USA. 115(50):12775–12780. [DOI] [PMC free article] [PubMed] [Google Scholar]
- Kaiser VB, Bachtrog D.. 2010. Evolution of sex chromosomes in insects. Annu Rev Genet. 44(1):91–112. [DOI] [PMC free article] [PubMed] [Google Scholar]
- Kanehisa M, Sato Y, Morishima K.. 2016. BlastKOALA and GhostKOALA: KEGG tools for functional characterization of genome and metagenome sequences. J Mol Biol. 428(4):726–731. [DOI] [PubMed] [Google Scholar]
- Katoh K, Standley DM.. 2013. MAFFT multiple sequence alignment software version 7: improvements in performance and usability. Mol Biol Evol. 30(4):772–780. [DOI] [PMC free article] [PubMed] [Google Scholar]
- Kim D, Langmead B, Salzberg SL.. 2015. HISAT: a fast spliced aligner with low memory requirements. Nat Methods. 12(4):357–360. [DOI] [PMC free article] [PubMed] [Google Scholar]
- Langmead B, Salzberg SL.. 2012. Fast gapped-read alignment with Bowtie 2. Nat Methods. 9(4):357–359. [DOI] [PMC free article] [PubMed] [Google Scholar]
- Li H, Handsaker B, Wysoker A, Fennell T, Ruan J, Homer N, Marth G, Abecasis G, Durbin R.. 2009. The sequence alignment/map format and SAMtools. Bioinformatics 25(16):2078–2079. [DOI] [PMC free article] [PubMed] [Google Scholar]
- Li L, Stoeckert CJ, Roos DS.. 2003. OrthoMCL: identification of ortholog groups for eukaryotic genomes. Genome Res. 13(9):2178–2189. [DOI] [PMC free article] [PubMed] [Google Scholar]
- Li W-H, Yi S, Makova K.. 2002. Male-driven evolution. Curr Opin Genet Dev. 12(6):650–656. [DOI] [PubMed] [Google Scholar]
- Li Y, Park H, Smith TE, Moran NA.. 2019. Gene family evolution in the pea aphid based on chromosome-level genome assembly. Mol Biol Evol. 36(10):2143–2156. [DOI] [PMC free article] [PubMed] [Google Scholar]
- Li Y, Zhang R, Liu S, Donath A, Peters RS, Ware J, Misof B, Niehuis O, Pfrender ME, Zhou X.. 2017. The molecular evolutionary dynamics of oxidative phosphorylation (OXPHOS) genes in Hymenoptera. BMC Evol Biol. 17(1):269. [DOI] [PMC free article] [PubMed] [Google Scholar]
- Love MI, Huber W, Anders S.. 2014. Moderated estimation of fold change and dispersion for RNA-seq data with DESeq2. Genome Biol. 15(12):550. [DOI] [PMC free article] [PubMed] [Google Scholar]
- Mandrioli M, Carlo Manicardi G.. 2012. Unlocking holocentric chromosomes: new perspectives from comparative and functional genomics? Curr Genomics. 13(5):343–349. [DOI] [PMC free article] [PubMed] [Google Scholar]
- Manicardi GC, Mandrioli M, Blackman RL.. 2015. The cytogenetic architecture of the aphid genome. Biol Rev. 90(1):112–125. [DOI] [PubMed] [Google Scholar]
- Melters DP, Paliulis LV, Korf IF, Chan S.. 2012. Holocentric chromosomes: convergent evolution, meiotic adaptations, and genomic analysis. Chromosome Res. 20(5):579–593. [DOI] [PubMed] [Google Scholar]
- Messthaler H, Traut W.. 1975. Phases of sex chromosome inactivation in Oncopeltus fasciatus and Pyrrhocoris apterus (Insecta, Heteroptera). Caryologia 28(4):501–510. [Google Scholar]
- Nabholz B, Ellegren H, Wolf J.. 2013. High levels of gene expression explain the strong evolutionary constraint of mitochondrial protein-coding genes. Mol Biol Evol. 30(2):272–284. [DOI] [PubMed] [Google Scholar]
- Pal A, Vicoso B.. 2015. The X chromosome of hemipteran insects: conservation, dosage compensation and sex-biased expression. Genome Biol Evol. 7(12):3259–3268. [DOI] [PMC free article] [PubMed] [Google Scholar]
- Pedersen BS, Quinlan AR.. 2018. mosdepth: quick coverage calculation for genomes and exomes. Bioinformatics 34(5):867–868. [DOI] [PMC free article] [PubMed] [Google Scholar]
- Purandare SR, Bickel RD, Jaquiery J, Rispe C, Brisson JA.. 2014. Accelerated evolution of morph-biased genes in Pea Aphids. Mol Biol Evol. 31(8):2073–2083. [DOI] [PMC free article] [PubMed] [Google Scholar]
- Putnam NH, O'Connell BL, Stites JC, Rice BJ, Blanchette M, Calef R, Troll CJ, Fields A, Hartley PD, Sugnet CW, et al. 2016. Chromosome-scale shotgun assembly using an in vitro method for long-range linkage. Genome Res. 26(3):342–350. [DOI] [PMC free article] [PubMed] [Google Scholar]
- Quinlan AR, Hall IM.. 2010. BEDTools: a flexible suite of utilities for comparing genomic features. Bioinformatics 26(6):841–842. [DOI] [PMC free article] [PubMed] [Google Scholar]
- R Core Team 2016. R: a language and environment for statistical computing. Vienna, Austria: R Foundation for Statistical Computing; Available from: https://www.R-project.org/ [Google Scholar]
- Rice WR. 1984. Sex chromosomes and the evolution of sexual dimorphism. Evolution 38(4):735–742. [DOI] [PubMed] [Google Scholar]
- Richard G, Legeai F, Prunier-Leterme N, Bretaudeau A, Tagu D, Jaquiéry J, Le Trionnaire G.. 2017. Dosage compensation and sex-specific epigenetic landscape of the X chromosome in the pea aphid. Epigenet Chromatin. 10(1):30. [DOI] [PMC free article] [PubMed] [Google Scholar]
- Riemann JG. 1966. Chromosome numbers in the Hackberry Psyllids Pachypsylla and Tetragonocephala (Homoptera: Psyllidae). Ann Entomol Soc Am. 59(6):1088–1093. [Google Scholar]
- Saha S, Hosmani PS, Villalobos-Ayala K, Miller S, Shippy T, Flores M, Rosendale A, Cordola C, Bell T, Mann H, et al. 2017. Improved annotation of the insect vector of citrus greening disease: biocuration by a diverse genomics community. Database 2017:bax032. Available from: https://www.ncbi.nlm.nih.gov/pmc/articles/PMC5502364/ [DOI] [PMC free article] [PubMed] [Google Scholar]
- Simão FA, Waterhouse RM, Ioannidis P, Kriventseva EV, Zdobnov EM.. 2015. BUSCO: assessing genome assembly and annotation completeness with single-copy orthologs. Bioinformatics 31(19):3210–3212. [DOI] [PubMed] [Google Scholar]
- Sloan DB, Nakabachi A, Richards S, Qu J, Murali SC, Gibbs RA, Moran NA.. 2014. Parallel histories of horizontal gene transfer facilitated extreme reduction of endosymbiont genomes in sap-feeding insects. Mol Biol Evol. 31(4):857–871. [DOI] [PMC free article] [PubMed] [Google Scholar]
- Smith TE, Moran NA.. 2020. Coordination of host and symbiont gene expression reveals a metabolic tug-of-war between aphids and Buchnera. Proc Natl Acad Sci USA. 117(4):2113–2121. [DOI] [PMC free article] [PubMed] [Google Scholar]
- Stanke M, Diekhans M, Baertsch R, Haussler D.. 2008. Using native and syntenically mapped cDNA alignments to improve de novo gene finding. Bioinformatics 24(5):637–644. [DOI] [PubMed] [Google Scholar]
- Stanke M, Schöffmann O, Morgenstern B, Waack S.. 2006. Gene prediction in eukaryotes with a generalized hidden Markov model that uses hints from external sources. BMC Bioinformatics 7(1):62. [DOI] [PMC free article] [PubMed] [Google Scholar]
- Sunnucks P, Chisholm D, Turak E, Hales DF.. 1998. Evolution of an ecological trait in parthenogenetic Sitobion aphids. Heredity 81(6):638–647. [Google Scholar]
- Tarazona S, Furió-Tarí P, Turrà D, Pietro AD, Nueda MJ, Ferrer A, Conesa A.. 2015. Data quality aware analysis of differential expression in RNA-seq with NOISeq R/Bioc package. Nucleic Acids Res. 43(21):e140–e140. [DOI] [PMC free article] [PubMed] [Google Scholar]
- Tarazona S, García-Alcalde F, Dopazo J, Ferrer A, Conesa A.. 2011. Differential expression in RNA-seq: a matter of depth. Genome Res. 21(12):2213–2223. [DOI] [PMC free article] [PubMed] [Google Scholar]
- Törönen P, Medlar A, Holm L.. 2018. PANNZER2: a rapid functional annotation web server. Nucleic Acids Res. 46(W1):W84–W88. [DOI] [PMC free article] [PubMed] [Google Scholar]
- Wang Y, Coleman-Derr D, Chen G, Gu YQ.. 2015. OrthoVenn: a web server for genome wide comparison and annotation of orthologous clusters across multiple species. Nucleic Acids Res. 43(W1):W78–W84. [DOI] [PMC free article] [PubMed] [Google Scholar]
- Wang Y, Tang H, DeBarry JD, Tan X, Li J, Wang X, Lee T, Jin H, Marler B, Guo H, et al. 2012. MCScanX: a toolkit for detection and evolutionary analysis of gene synteny and collinearity. Nucleic Acids Res. 40(7):e49. [DOI] [PMC free article] [PubMed] [Google Scholar]
- Wickham H. 2016. ggplot2: elegant graphics for data analysis. New York: Springer-Verlag. Available from: http://ggplot2.org.
- Xu L, Dong Z, Fang L, Luo Y, Wei Z, Guo H, Zhang G, Gu YQ, Coleman-Derr D, Xia Q, et al. 2019. OrthoVenn2: a web server for whole-genome comparison and annotation of orthologous clusters across multiple species. Nucleic Acids Res. 47(W1):W52–W58. [DOI] [PMC free article] [PubMed] [Google Scholar]
- Zdobnov EM, Tegenfeldt F, Kuznetsov D, Waterhouse RM, Simao FA, Ioannidis P, Seppey M, Loetscher A, Kriventseva EV.. 2017. OrthoDB v9. 1: cataloging evolutionary and functional annotations for animal, fungal, plant, archaeal, bacterial and viral orthologs. Nucleic Acids Res. 45(D1):D744–D749. [DOI] [PMC free article] [PubMed] [Google Scholar]
- Zhang Z, Li J, Zhao X-Q, Wang J, Wong G-S, Yu J.. 2006. KaKs_Calculator: calculating Ka and Ks through model selection and model averaging. Genomics Proteomics Bioinform. 4(4):259–263. [DOI] [PMC free article] [PubMed] [Google Scholar]
Associated Data
This section collects any data citations, data availability statements, or supplementary materials included in this article.
Supplementary Materials
Data Availability Statement
Pachypsylla venusta genome assembly and sequencing data are available on NCBI under the BioProject ID PRJNA603545. The bioinformatic scripts used in this study are available on GitHub (https://github.com/lyy005/Psyllid_chromosome_assembly, last accessed March 19, 2020).