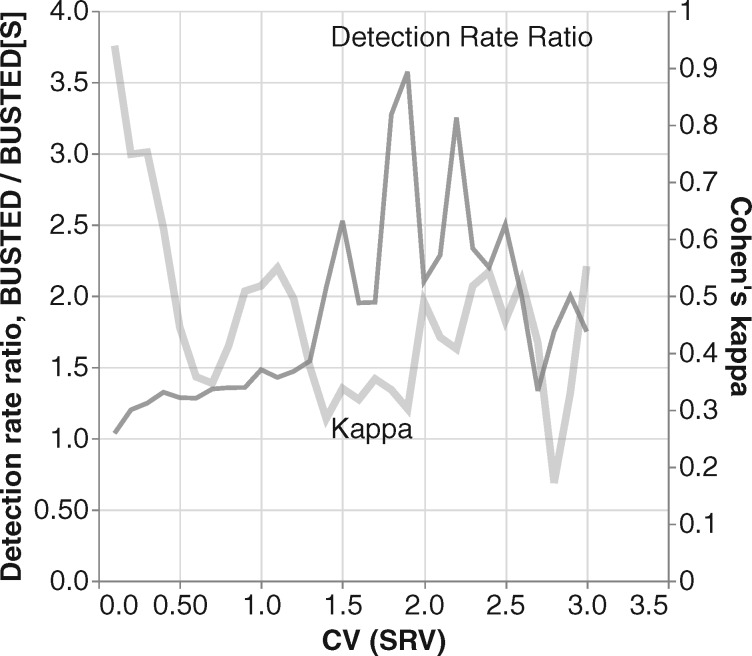
Fig. 2.
Comparison of method results on Selectome data as a function of the level of SRV. The two plots show relationships between the level of SRV (x-axis) and either the relative selection detection rates of BUSTED and BUSTED[S] (left y-axis, black plot) or Cohen’s measure of method concordance (right y-axis, gray plot). The plots are sliding window analyses using a window size of 0.2 and a step size of 0.1. Windows with <10 points are not plotted to reduce noise.

