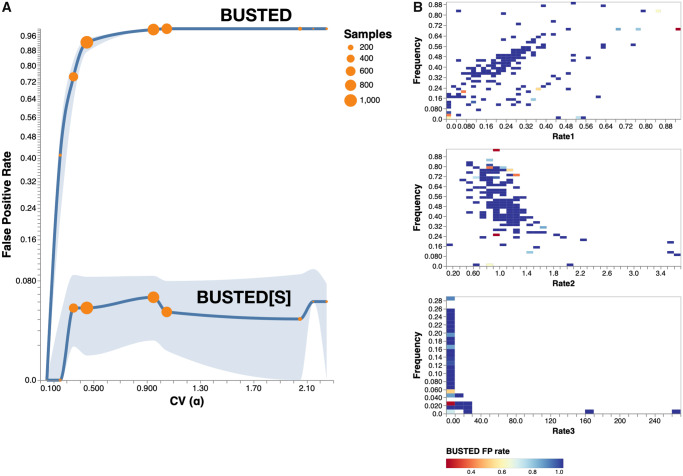
Fig. 5.
Method performance on null simulations with varied distributions of rates. (A) FPRs of BUSTED and BUSTED[S] as a function of simulated on neutrally evolving data; the distributions of rates used for simulations were varied and derived from a large empirical data set of avian genes analyzed by Shultz and Sackton (2019). The solid curve is the rate for nominal P = 0.05, and the shaded areas delimit the corresponding values for P = 0.01 (lower bound) and P = 0.1 (upper bound). The number of simulations used to estimate rates for each bin of is reflected in the size of the circle. Note the nonlinear scale on the y-axis. (B) The rate at which BUSTED makes false positive errors (at nominal P = 0.05), as a function of the α values used in the simulations. The plot is restricted to data sets where , which is the value where the catastrophic loss of false positive rate control begins. Because the distributions were drawn from empirical alignments, they reflect what is encountered in biological data but do not fill the parameter space completely; because the α distribution must have unit mean, some combination of rates and frequencies are not feasible (e.g., the maximum frequency of cannot exceed ).

