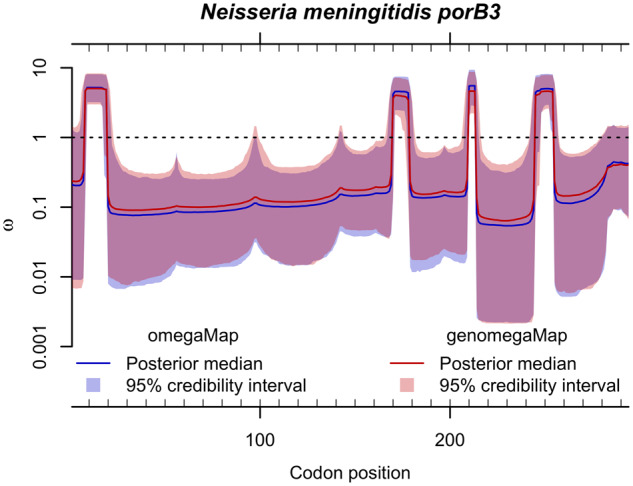
Fig. 1.

Comparison of omegaMap and genomegaMap estimates of the ratio ω along the porB3 outer membrane protein gene of Neisseria meningitidis. Solid lines and shaded regions show the point estimates (posterior medians) and 95% credibility intervals, respectively, for omegaMap (in blue) and genomegaMap (in red). The genomegaMap runs were 4.9 times faster for these 23 sequences at 92 min each.
