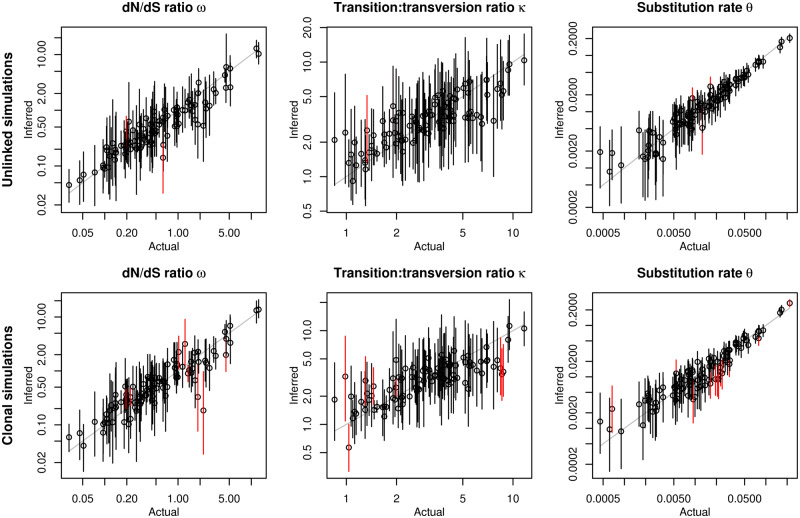
Fig. 2.
Performance of genomegaMap inference of ω, κ, and θ in simulations. In the Unlinked simulations (top row), every codon was simulated independently, favoring the genomegaMap assumption. In the Clonal simulations (bottom row), all codons were completely linked, disfavoring the genomegaMap assumption. Point estimates (posterior medians) and 95% credibility intervals are indicated by the circles and solid vertical lines, respectively, the latter colored red when they exclude the actual parameter. The number of simulations (out of 100) in which the 95% credibility intervals included the actual values of ω, κ, and θ were 98, 98, and 97 in the Unlinked simulations and 92, 92, and 88 in the Clonal simulations. The correlation between the point estimates and actual values of , and were 0.86, 0.69, and 0.92 in the Unlinked simulations and 0.82, 0.61, and 0.88 in the Clonal simulations.

