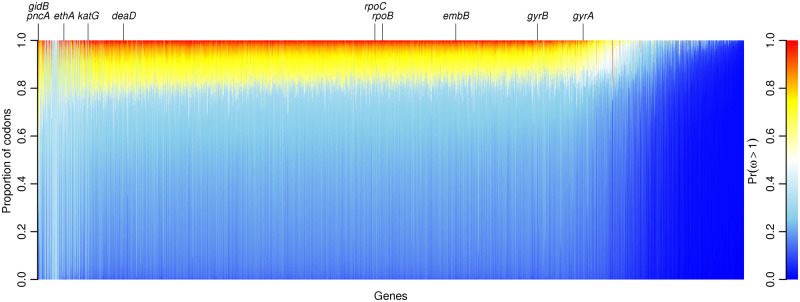
Fig. 3.
The evidence for positive selection across 3,979 genes in 10,209 Mycobacterium tuberculosis genomes. Each column is a stacked bar chart showing the proportion of codons in one gene with a given strength of evidence for positive selection, indicated by color. Blue indicates weakest evidence, , whereas red indicates strongest evidence, . Genes are ordered left-to-right by the mean across codons, from highest to lowest. Notable genes containing codons with strong evidence of positive selection are labeled; these occur across the spectrum. The genes with predominantly sky blue color, scattered between pncA and katG, contained little information because they mapped poorly to the reference genome.

